

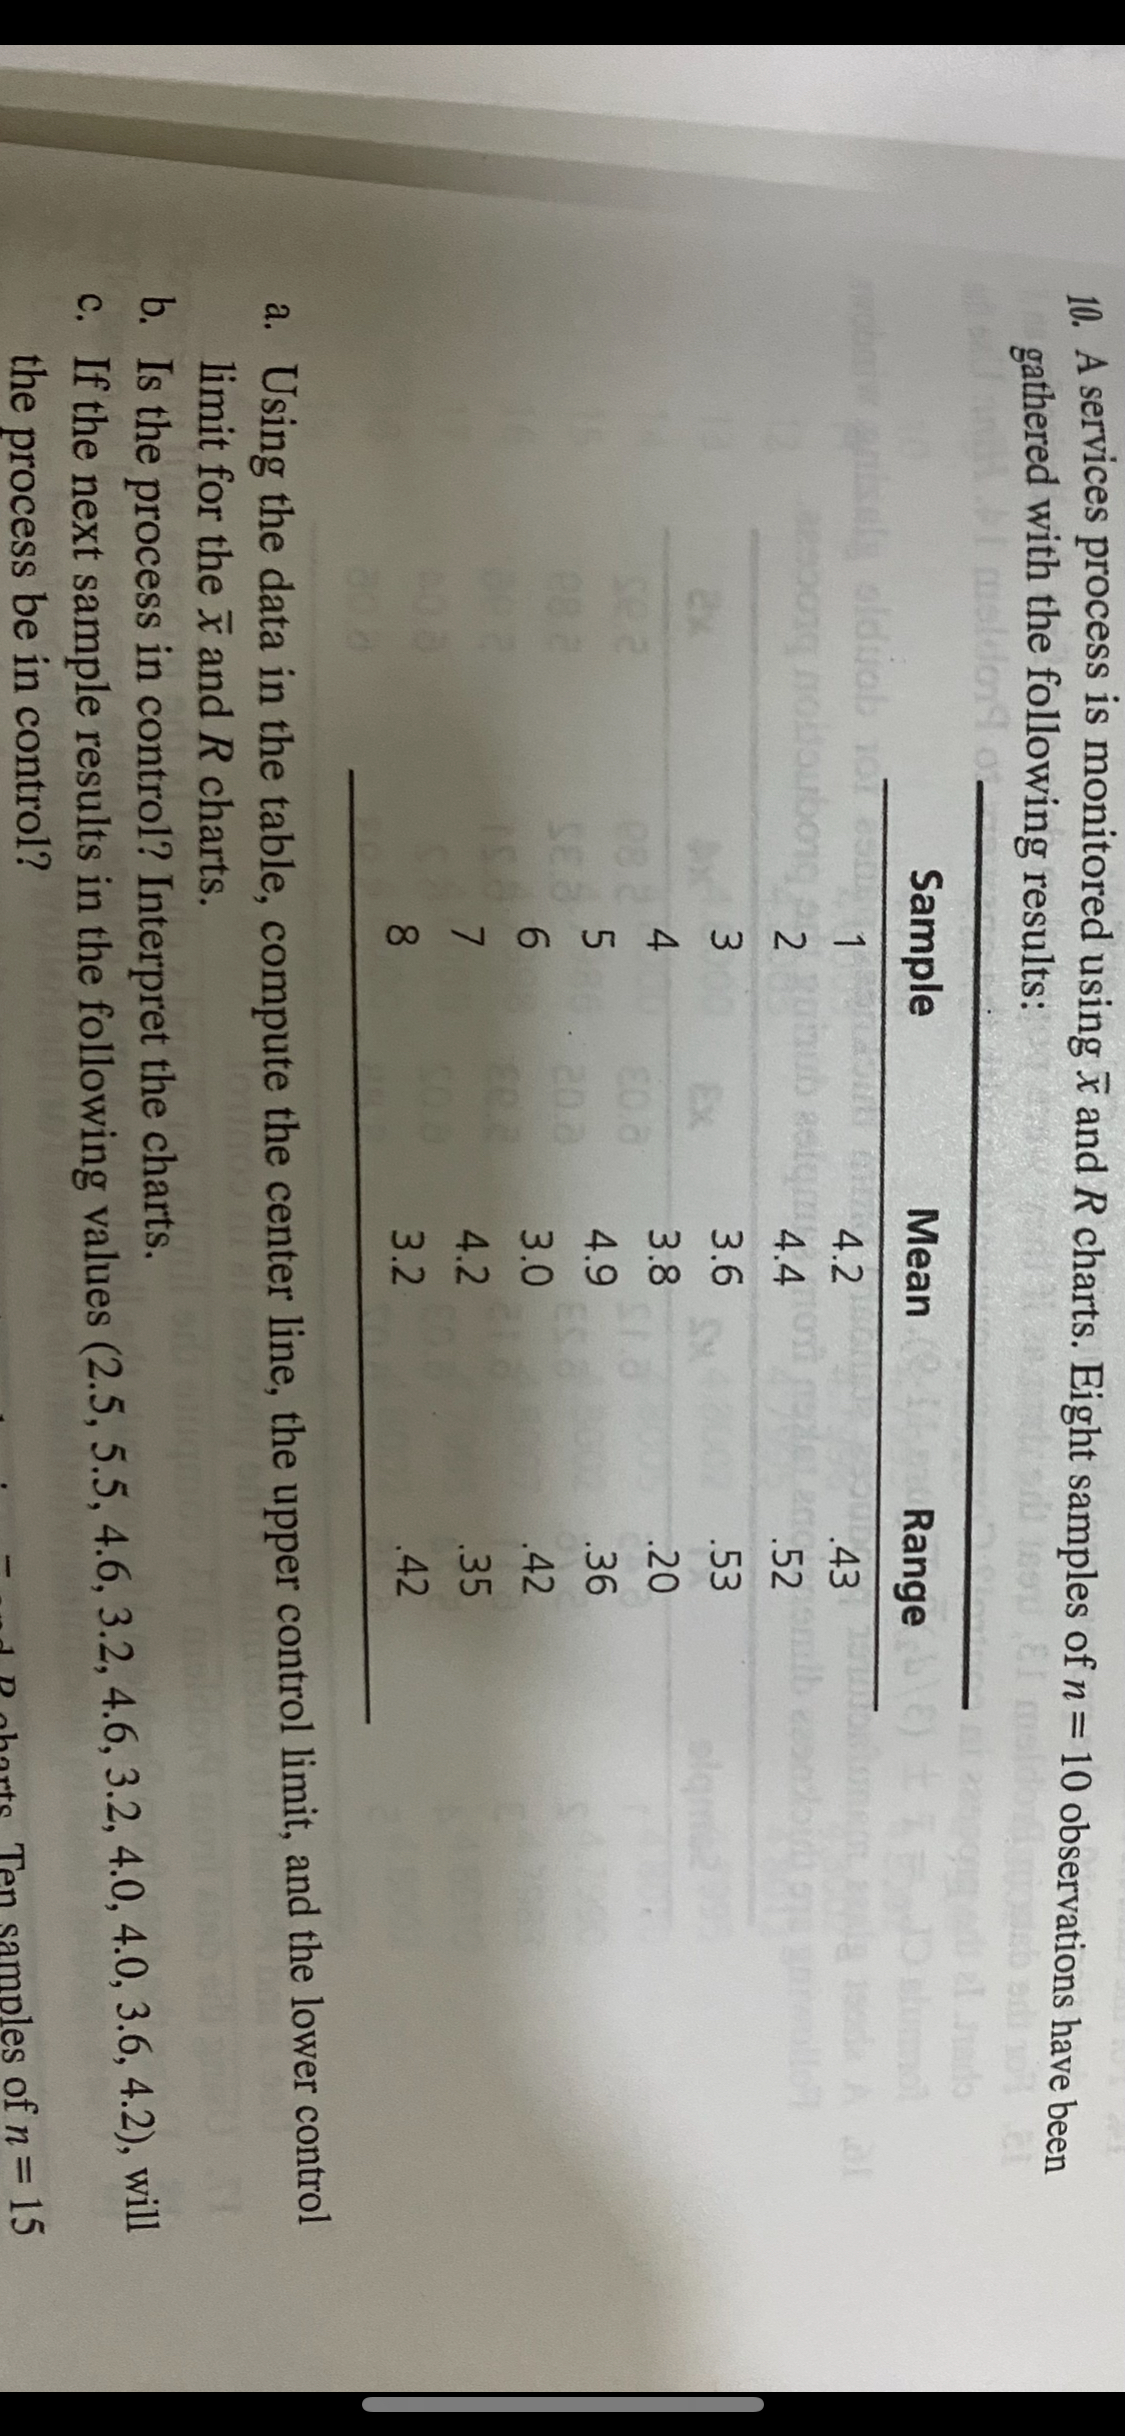
Question: A services process is monitored using x and R charts. Eight samples of n = 1 0 observations have been gathered with the following results:
A services process is monitored using and charts. Eight samples of observations have been gathered with the following results:
tableSampleMean,Range
a Using the data in the table, compute the center line, the upper control limit and the lower control limit for the and charts.
b Is the process in control? Interpret the charts.
c If the next sample results in the following values will the process be in control?
Step by Step Solution
There are 3 Steps involved in it
1 Expert Approved Answer
Step: 1 Unlock

Question Has Been Solved by an Expert!
Get step-by-step solutions from verified subject matter experts
Step: 2 Unlock
Step: 3 Unlock