

Question: 10. A services process is monitored using and R charts. Eight samples gathered with the following results: Sample 1 N34607 00 2 5 8 Mean
10. A services process is monitored using and R charts. Eight samples gathered with the following results: Sample 1 N34607 00 2 5 8 Mean 4.2 4.4 3.6 3.8 4.9 3.0 4.2 3.2 343 Range 43 52 3 20 26 2 35 42 53 .36 42 R bservations have been 3.94 2.1 a. Using the data in the table, compute the center line, the upper control limit, and the lower control limit for the x and R charts. b. Is the process in control? Interpret the charts. c. If the next sample results in the following values (2.5, 5.5, 4.6, 3.2, 4.6, 3.2, 4.0, 4.0, 3.6, 4.2), will the process be in control?
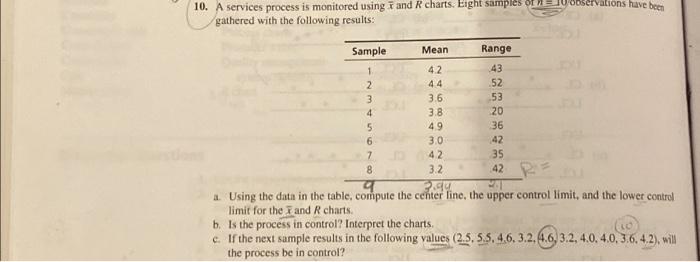
0. A services process is monitored using x and R charts. Eight samples or n=10 ooservalions have been gathered with the following results: a. Using the data in the table, compute the cchter line, the upper control limit, and the lower control limit for the x~ and R charts. b. Is the process in control? Interpret the charts. c. If the next sample results in the following values (2.5,5.5,4,6,3.2,4.6,3.2,4.0,4.0,3.6,4.2), will the process be in control
Step by Step Solution
There are 3 Steps involved in it
1 Expert Approved Answer
Step: 1 Unlock

Question Has Been Solved by an Expert!
Get step-by-step solutions from verified subject matter experts
Step: 2 Unlock
Step: 3 Unlock