

Question: #10 please solve ASAP! OK to Assignment Altempts Keep the Highest 1 10. Market equilibrium The following table shows the weekly demand and supply in

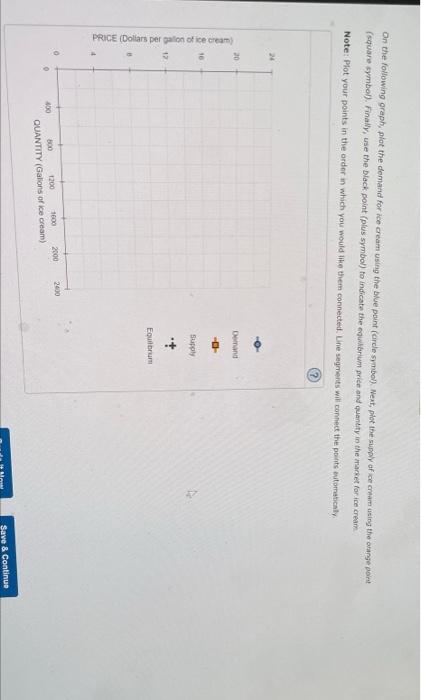
OK to Assignment Altempts Keep the Highest 1 10. Market equilibrium The following table shows the weekly demand and supply in the market for ce cream in Detroit Price (Dollars per gallon of ice cream) 5 Quantity Demanded Quantity Supplied (Gallons of ice cream) (Gallons of ice cream) 2,000 200 1,600 600 1,200 800 100 1.200 400 1,800 12 16 20 On the following graph plot the demand for ice cream using the blue point (circle symbol). Next, plot the supply of ice cream using the orange point (square symbol). Finally, use the black point (plus symbol) to indicate the equitum price and quantity in the market for ice cream Note: Plot your points in the order in which you would like them connected. Line segments will connect the points automatically On the following graph, plot the demand for ice cream using the blue point (circle symbol). Next, plot the supply of ice cream in the orange point (square symbol). Finally, use the black point (plus symbol) to indicate the equibrum price and quantity in the market for ice cream Note: Plot your points in the order in which you would like them connected. Line segments will connect the points automatically 20 Demand 18 Supory PRICE (Dollars per gallon of ice cream) ua Equilibrium o 2000 450 100 200 1000 2000 QUANTITY (Galions of ice cream) Save & Continue
Step by Step Solution
There are 3 Steps involved in it

Get step-by-step solutions from verified subject matter experts