

Question: 10. The figure below shows an X-ray diffraction pattern for lead taken using a diffractometer and monochromatic x-radiation having a wavelength of 0.1542 nm; each
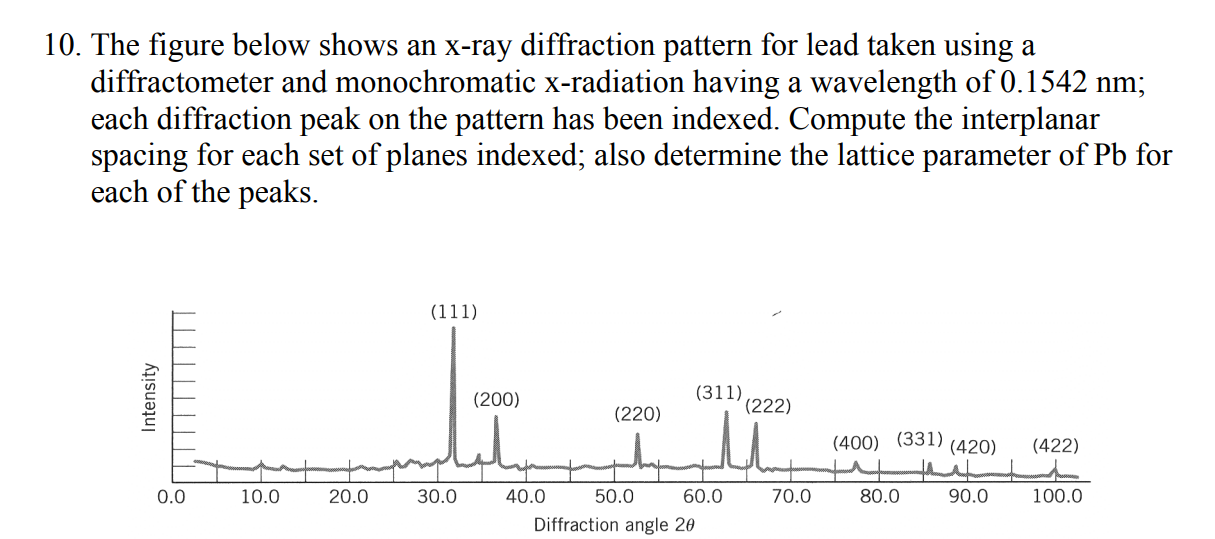
10. The figure below shows an X-ray diffraction pattern for lead taken using a diffractometer and monochromatic x-radiation having a wavelength of 0.1542 nm; each diffraction peak on the pattern has been indexed. Compute the interplanar spacing for each set of planes indexed; also determine the lattice parameter of Pb for each of the peaks. (111) Intensity (200) (311) (220) (222) M (400) (331) (420) (422) 0.0 10.0 20.0 30.0 70.0 80.0 90.0 100.0 40.0 50.0 60.0 Diffraction angle 20
Step by Step Solution
There are 3 Steps involved in it
1 Expert Approved Answer
Step: 1 Unlock

Question Has Been Solved by an Expert!
Get step-by-step solutions from verified subject matter experts
Step: 2 Unlock
Step: 3 Unlock