

Question: 10. Using horizontal analysis, calculate the changes in the key SFP categories from 2019 to 2020. Please write dollar amounts in thousands. Example: $100,000 is
10.
Using horizontal analysis, calculate the changes in the key SFP categories from 2019 to 2020. Please write dollar amounts in thousands. Example: $100,000 is written as $100. (Enter negative amounts using either a negative sign preceding the number e.g. -45 or parentheses e.g. (45). Round answers to 0 decimal places, e.g. 52%.)
| 2020 (000s) | 2019 (000s) | Difference | % Change | |||||
| Current assets | $ | $ | $ | % | ||||
| Non-current assets | % | |||||||
| Current liabilities | % | |||||||
| Non-current liabilities | % | |||||||
| Common shares | % | |||||||
| Retained earnings | % |
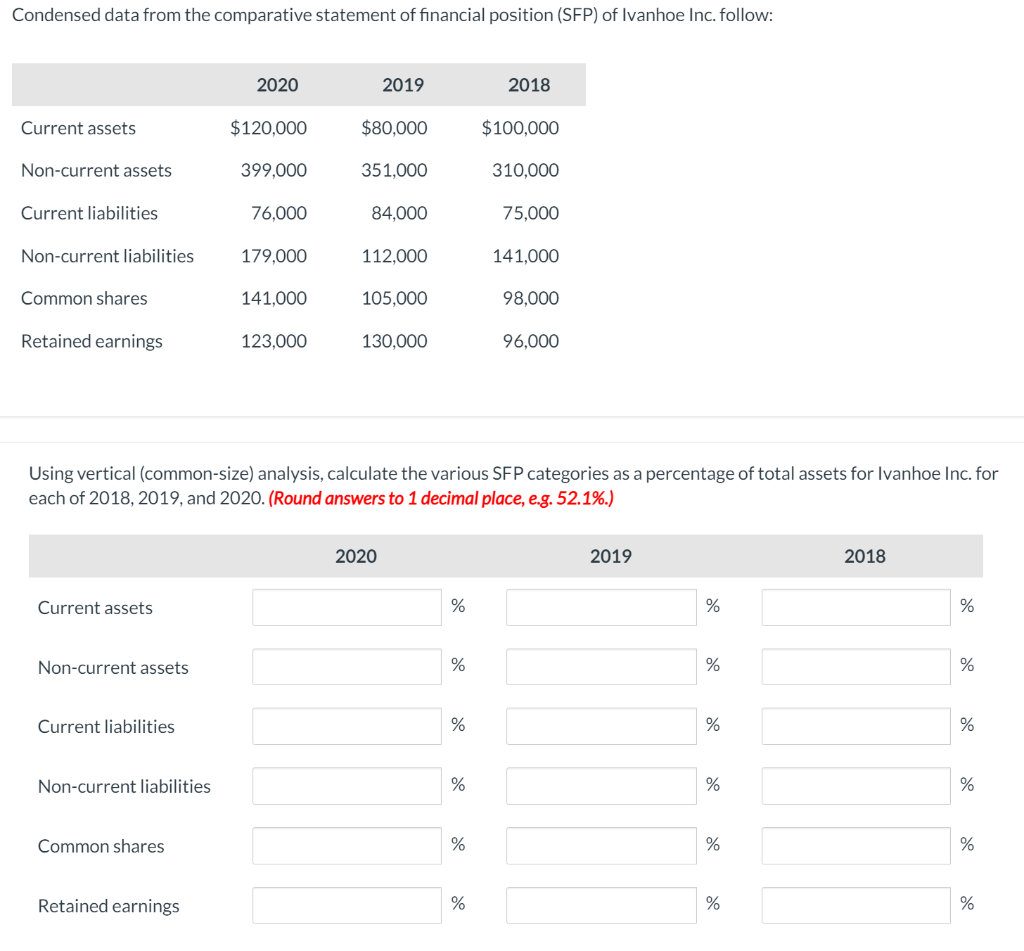
Condensed data from the comparative statement of financial position (SFP) of Ivanhoe Inc. follow: 2020 2019 2018 Current assets $120,000 $80,000 $100,000 Non-current assets 399,000 351,000 310,000 Current liabilities 76,000 84,000 75,000 Non-current liabilities 179,000 112,000 141,000 Common shares 141,000 105,000 98,000 Retained earnings 123,000 130,000 96,000 Using vertical (common-size) analysis, calculate the various SFP categories as a percentage of total assets for Ivanhoe Inc. for each of 2018, 2019, and 2020. (Round answers to 1 decimal place, e.g. 52.1%.) 2020 2019 2018 Current assets % % % Non-current assets % % % Current liabilities % % % Non-current liabilities % % % Common shares % % % Retained earnings % % %
Step by Step Solution
There are 3 Steps involved in it

Get step-by-step solutions from verified subject matter experts