

Question: Condensed data from the comparative statement of financial position (SFP) of Blossom Inc. follow: 2020 2019 2018 Current assets $120,000 $80,000 $100,000 Non-current assets 390,000
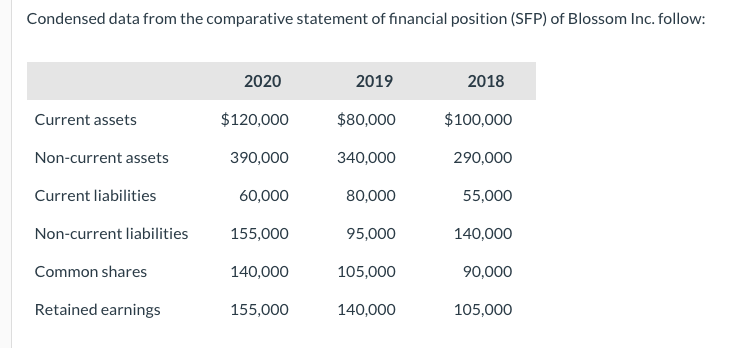
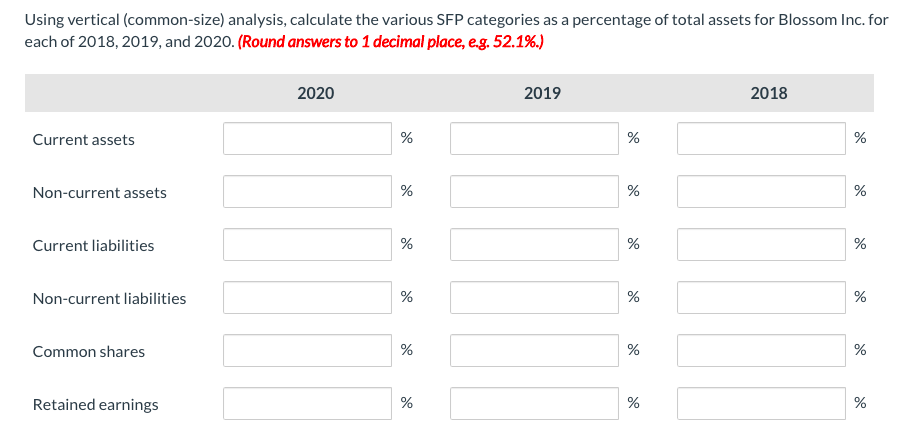
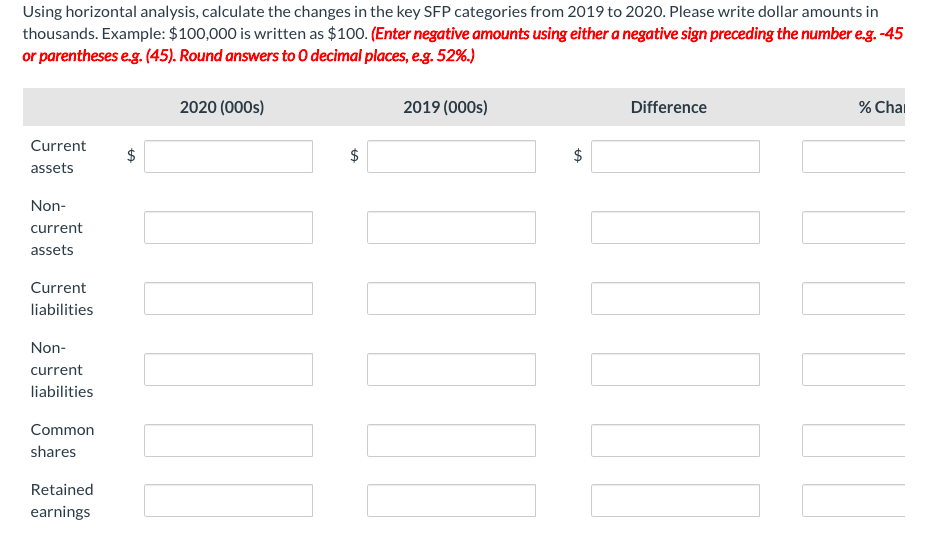
Condensed data from the comparative statement of financial position (SFP) of Blossom Inc. follow: 2020 2019 2018 Current assets $120,000 $80,000 $100,000 Non-current assets 390,000 340,000 290,000 Current liabilities 60,000 80,000 55,000 Non-current liabilities 155,000 95,000 140,000 Common shares 140,000 105,000 90,000 Retained earnings 155,000 140,000 105,000 Using vertical (common-size) analysis, calculate the various SFP categories as a percentage of total assets for Blossom Inc. for each of 2018, 2019, and 2020. (Round answers to 1 decimal place, eg. 52.1%.) 2020 2019 2018 Current assets % % % Non-current assets % % % Current liabilities % % % Non-current liabilities % % % Common shares % % % Retained earnings % % % Using horizontal analysis, calculate the changes in the key SFP categories from 2019 to 2020. Please write dollar amounts in thousands. Example: $100,000 is written as $100. (Enter negative amounts using either a negative sign preceding the number e.g. -45 or parentheses eg. (45). Round answers to 0 decimal places, eg. 52%.) 2020 (000s) 2019 (000s) Difference % Chai Current assets $ $ $ Non- current assets Current liabilities Non- current liabilities Common shares Retained earnings
Step by Step Solution
There are 3 Steps involved in it

Get step-by-step solutions from verified subject matter experts