

Question: Condensed data from the comparative statement of financial position (SFP) of Wildhorse Inc. follow: 2020 2019 2018 Current assets $120,000 $80,000 $100,000 Non-current assets -
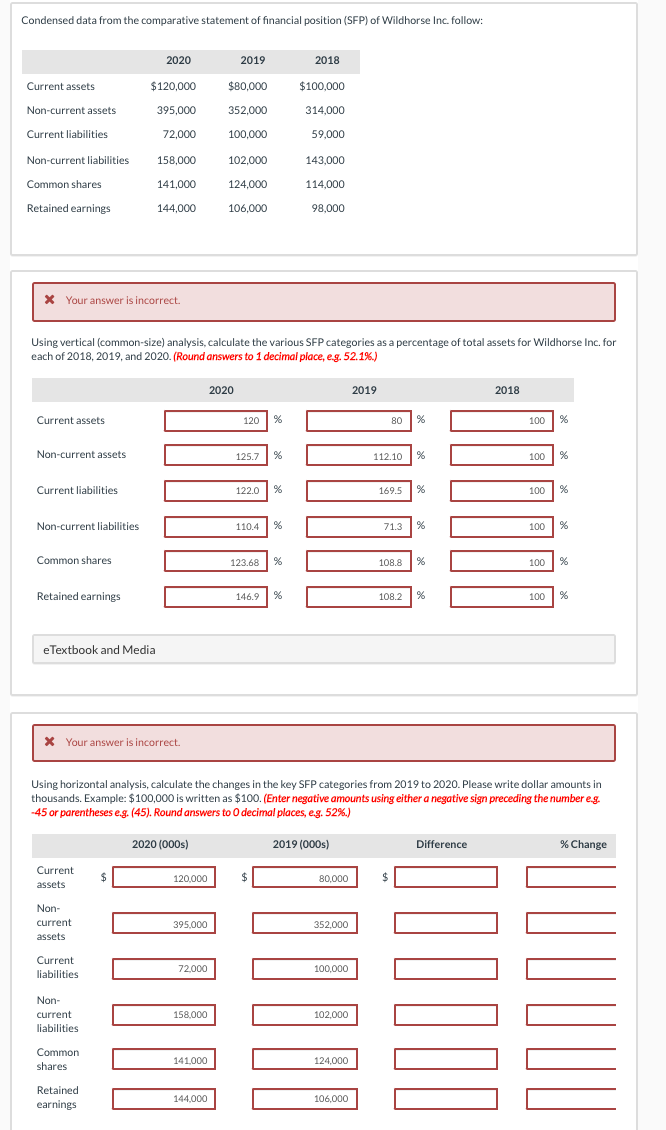
Condensed data from the comparative statement of financial position (SFP) of Wildhorse Inc. follow: 2020 2019 2018 Current assets $120,000 $80,000 $100,000 Non-current assets - 352.000 314,000 395,000 72,000 Current liabilities 100,000 59,000 Non-current liabilities - 158,000 102,000 143,000 114,000 141,000 124,000 Common shares Retained earnings 144,000 106,000 98,000 * Your answer is incorrect. Using vertical (common-size) analysis, calculate the various SFP categories as a percentage of total assets for Wildhorse Inc. for each of 2018, 2019 and 2020. (Round answers to 1 decimal place, e.g. 52.1%.) 2020 2019 2018 Current assets 120 % 80 % 100 % Non-current assets - 125.7 % 112.10 % 100 % Current liabilities 122.0 % 169.5 % 100 % Non-current liabilities 110.4 % 71.3 % 100 % Common shares 123.68 % 108.8 % 100 % Retained earnings 146.9 % 108.2 % 100 % e Textbook and Media X Your answer is incorrect. Using horizontal analysis, calculate the changes in the key SFP categories from 2019 to 2020. Please write dollar amounts in thousands. Example: $100,000 is written as $100. (Enter negative amounts using either a negative sign preceding the number eg. -45 or parentheses eg. (45). Round answers to decimal places, eg. 52%.) 2020 (000s) 2019 (000s) Difference % Change % Current assets $ 120.000 $ 80,000 $ Non- current assets 395.000 352.000 Current liabilities 72.000 100,000 000000 0001 DILDID Non- current liabilities 158.000 102,000 Common shares 141.000 124,000 Retained earnings 144,000 106,000
Step by Step Solution
There are 3 Steps involved in it

Get step-by-step solutions from verified subject matter experts