

Question: 100% + E3 View Zoom Add Page Insert Table Chart Text Shape Media Comment Collaborate Format Document 2. The box plot below shows the time
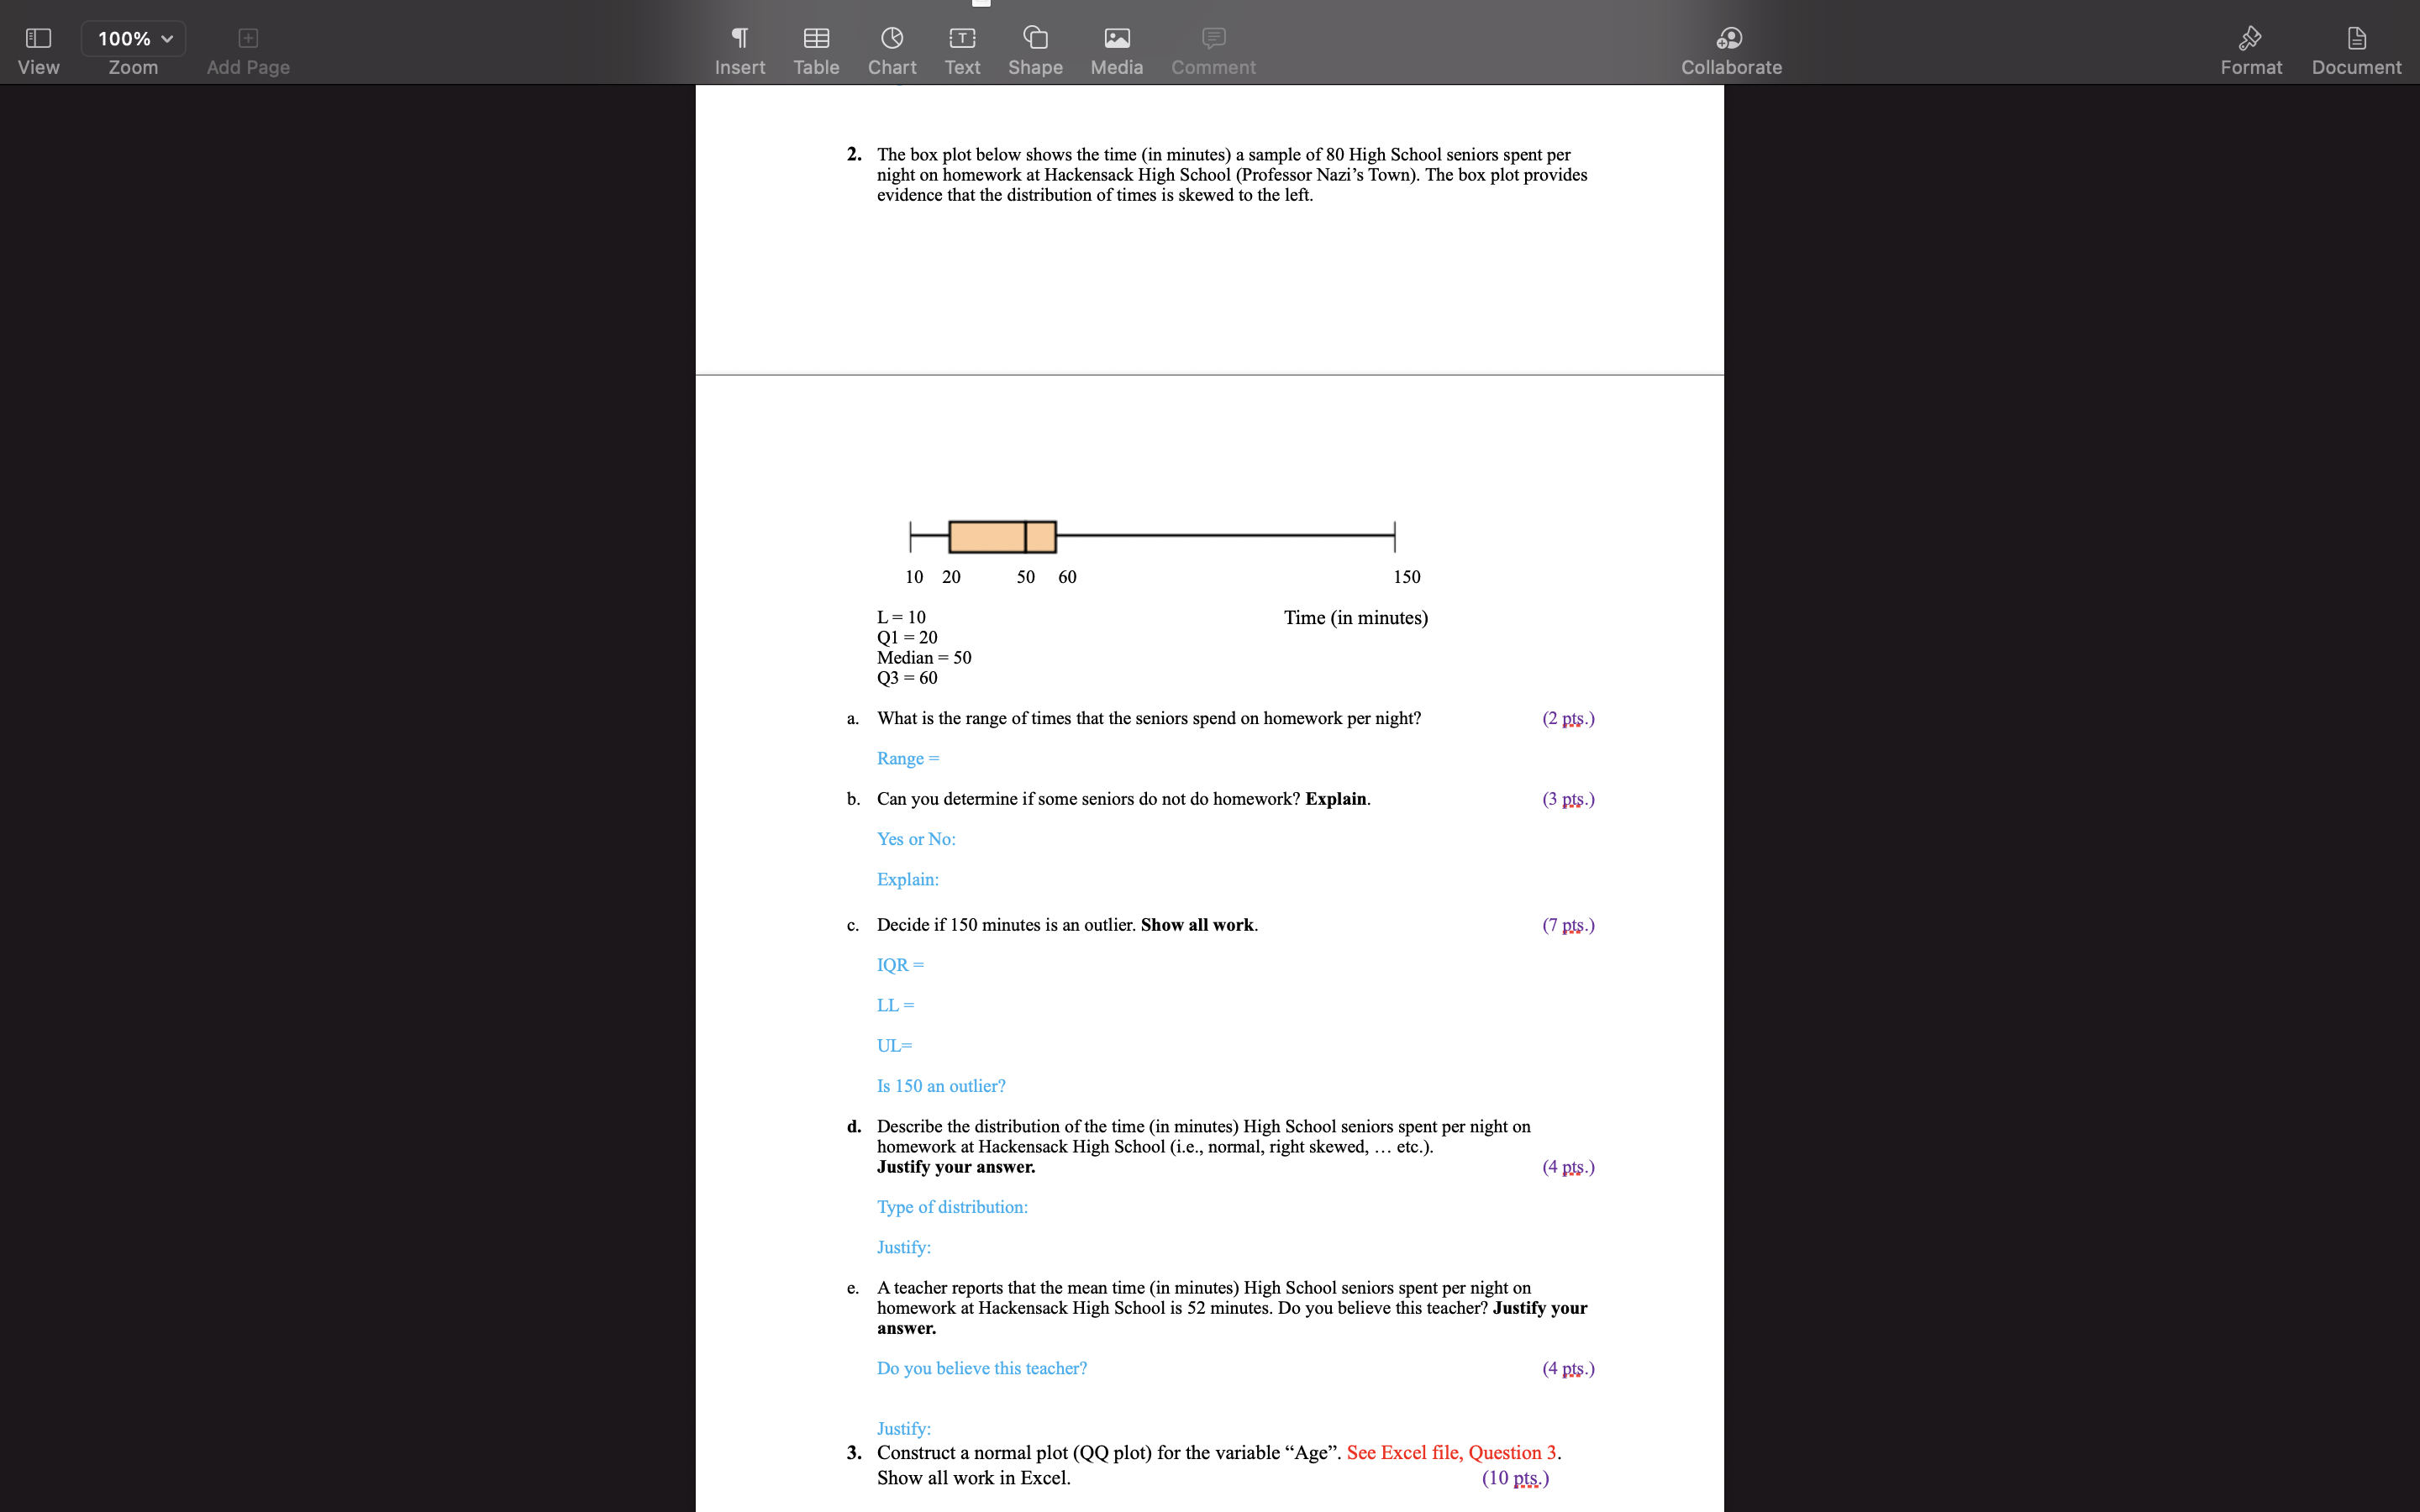
100% + E3 View Zoom Add Page Insert Table Chart Text Shape Media Comment Collaborate Format Document 2. The box plot below shows the time (in minutes) a sample of 80 High School seniors spent per night on homework at Hackensack High School (Professor Nazi's Town). The box plot provides evidence that the distribution of times is skewed to the left. 10 20 50 60 150 L = 10 Time (in minutes) Q1 = 20 Median = 50 03 = 60 a. What is the range of times that the seniors spend on homework per night? (2 pts.) Range b. Can you determine if some seniors do not do homework? Explain. (3 pts.) Yes or No: Explain: c. Decide if 150 minutes is an outlier. Show all work. (7 pts.) IOR = LL = UL= Is 150 an outlier? d. Describe the distribution of the time (in minutes) High School seniors spent per night on homework at Hackensack High School (i.e., normal, right skewed, ... etc.). Justify your answer. (4 pts.) Type of distribution: Justify e. A teacher reports that the mean time (in minutes) High School seniors spent per night on homework at Hackensack High School is 52 minutes. Do you believe this teacher? Justify your answer Do you believe this teacher? (4 pts.) Justify: 3. Construct a normal plot (QQ plot) for the variable "Age". See Excel file, Question 3. Show all work in Excel. (10 pts.)
Step by Step Solution
There are 3 Steps involved in it

Get step-by-step solutions from verified subject matter experts