

Question: 101 3 2 Which equation best represents the data shown in the scatterplot 6 8 9 X Which eqati6n bSt tepreSentg:

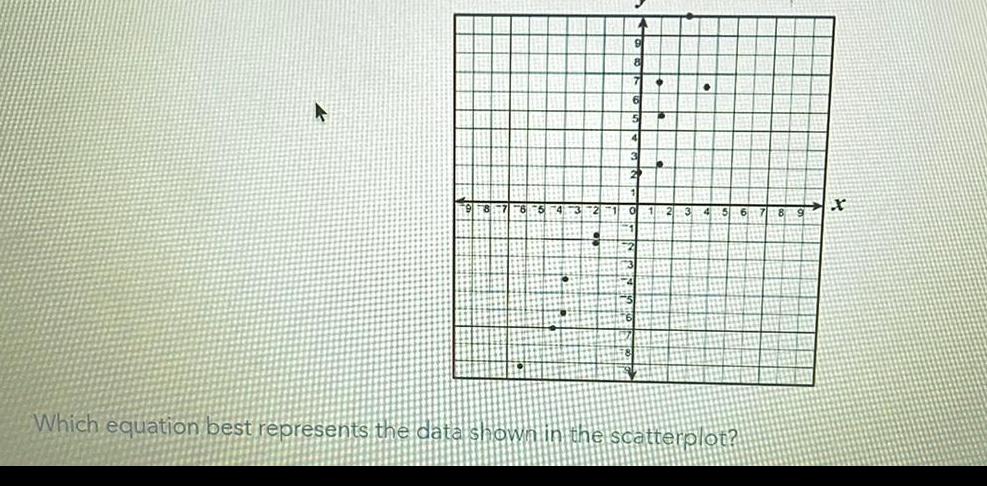
101 3 2 Which equation best represents the data shown in the scatterplot 6 8 9 X
Which eqati6n bSt tepreSentg:
Step by Step Solution
There are 3 Steps involved in it
1 Expert Approved Answer
Step: 1 Unlock

Question Has Been Solved by an Expert!
Get step-by-step solutions from verified subject matter experts
Step: 2 Unlock
Step: 3 Unlock