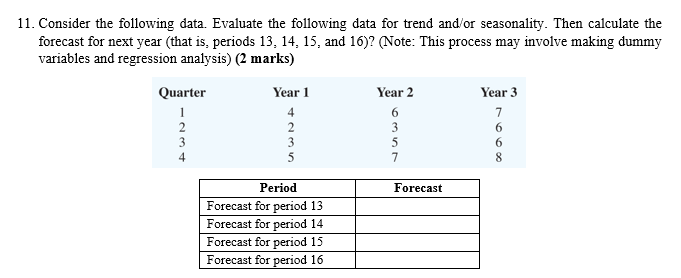
Question: 11. Consider the following data. Evaluate the following data for trend and/or seasonality. Then calculate the forecast for next year (that is, periods 13, 14,

11. Consider the following data. Evaluate the11. Consider the following data. Evaluate the

11. Consider the following data. Evaluate the following data for trend and/or seasonality. Then calculate the forecast for next year (that is, periods 13, 14, 15, and 16)2 (Note: This process may involve making dummy variables and regression analysis) (2 marks) Quarter Year 1 Year 2 Year 3 1 4 6 7 2 2 3 3 3 5 AN M 6 6 8 4 5 7 Forecast Period Forecast for period 13 Forecast for period 14 Forecast for period 15 Forecast for period 16 13. Using the same data, in question 11, determine the median, (11) trimmed mean of 80% values, (iii) skewness, and (iv) kurtosis of variable-1 in R-Studio? For this question, you cannot use Excel (2 points) Statistical test Value Median Trimmed mean Skewness kurtosis 14. Using the same data, in question 11, make a histogram and bar plot for variable-2 and copy-paste the histogram here: (to copy histogram click the Export button in the plots window, above the figure copy to clipboard, paste in word) (2 points)

Step by Step Solution

There are 3 Steps involved in it

1 Expert Approved Answer
Step: 1 Unlock blur-text-image
Question Has Been Solved by an Expert!

Get step-by-step solutions from verified subject matter experts

Step: 2 Unlock
Step: 3 Unlock

Students Have Also Explored These Related General Management Questions!