

Question: 11. What is the expected mortality rate for a county with an exposure index of 3? 12. Calculate two points that fall on the fitted
11. What is the expected mortality rate for a county with an exposure index of 3?
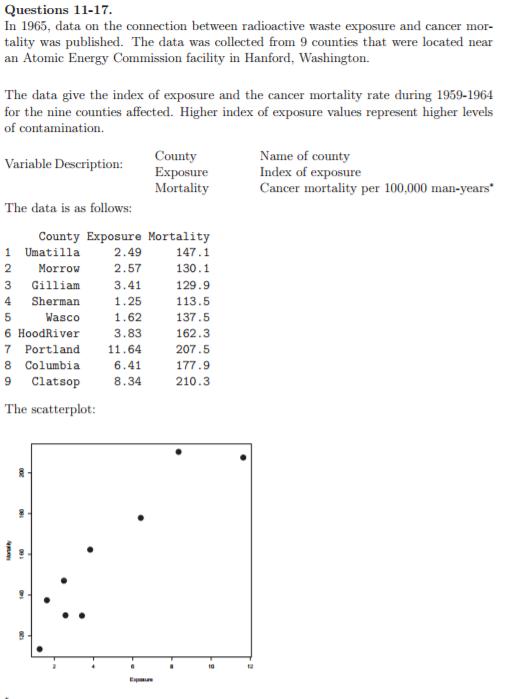
12. Calculate two points that fall on the fitted line (and would fall in the window of the scatterplot shown), draw the two points on the scatterplot, and connect them to show the fitted line. [6 pts] Show your work for calculating the points.
13. Interpret the estimated slope of the fitted model
14. What is the correlation between Mortality and Exposure?
Questions 11-17. In 1965, data on the connection between radioactive waste exposure and cancer mor- tality was published. The data was collected from 9 counties that were located near an Atomic Energy Commission facility in Hanford, Washington. The data give the index of exposure and the cancer mortality rate during 1959-1964 for the nine counties affected. Higher index of exposure values represent higher levels of contamination. County Variable Description: Name of county Index of exposure Exposure Mortality Cancer mortality per 100,000 man-years* The data is as follows: County Exposure Mortality 1 Umatilla 2.49 147.1 2 Morrow 2.57 130.1 3 Gilliam 3.41 129.9 4 Sherman 1.25 113.5 5 Wasco 1.62 137.5 6 HoodRiver 3.83 162.3 7 Portland 11.64 207.5 8 Columbia 6.41 177.9 9 Clatsop 8.34 210.3 The scatterplot: Exp 12
Step by Step Solution
3.39 Rating (140 Votes )
There are 3 Steps involved in it
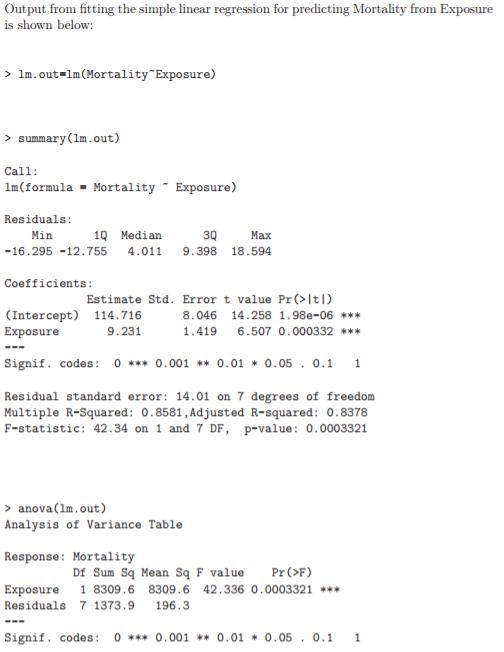
The regression equation is Mortality1147169231Exposure 11 the expe... View full answer

Get step-by-step solutions from verified subject matter experts