

Question: 11-5 Using the data in the following table, estimate (a) the average return and volatility for each stock, (b) the covariance between the stocks, and
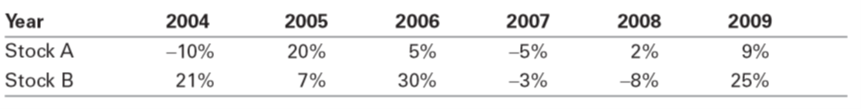
11-5 Using the data in the following table, estimate (a) the average return and volatility for each stock, (b) the covariance between the stocks, and (c) the correlation between these two stocks.
11-6. Use the data in Problem 5, consider a portfolio that maintains a 50% weight on stock A and a 50% weight on stock B.
a. What is the return each year of this portfolio?
b. Based on your results from part a, compute the average return and volatility of the portfolio.
c. Show that (i) the average return of the portfolio is equal to the average of the average returns of the two stocks, and (ii) the volatility of the portfolio equals the same result as from the calculation in Eq. 11.9.
d. Explain why the portfolio has a lower volatility than the average volatility of the two stocks.
\begin{tabular}{lrrrrrr} Year & 2004 & 2005 & 2006 & 2007 & 2008 & 2009 \\ \hline Stock A & 10% & 20% & 5% & 5% & 2% & 9% \\ Stock B & 21% & 7% & 30% & 3% & 8% & 25% \\ \hline \end{tabular}
Step by Step Solution
There are 3 Steps involved in it

Get step-by-step solutions from verified subject matter experts