

Question: Using the data in the following table, estimate (a) the average return and volatility for each stock, (b) the covariance between the stocks, and (c)
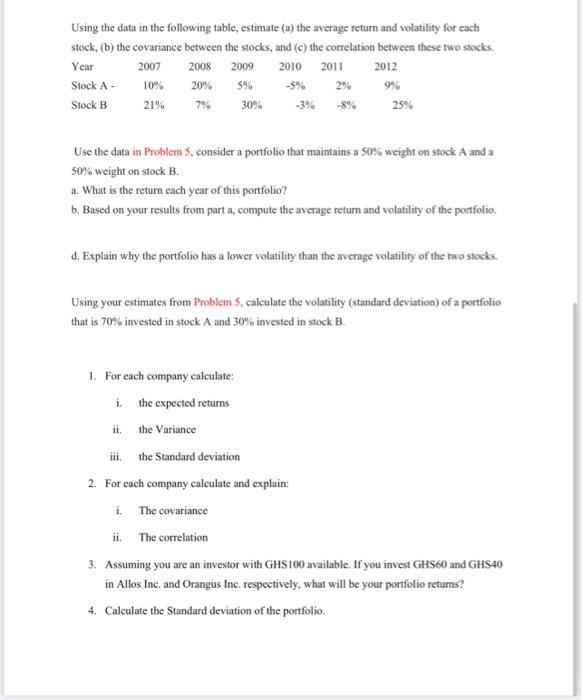
Using the data in the following table, estimate (a) the average return and volatility for each stock, (b) the covariance between the stocks, and (c) the correlation between these two stocks Year 2007 2008 2009 2010 2011 2012 Stock A 10% 20% 5% 9% Stock B 21% 7% 30% 25% Use the data in Problems, consider a portfolio that maintains a 50% weight on stock A and a 50% weight on stock B. a. What is the return each year of this portfolio? b. Based on your results from part a, compute the average return and volatility of the portfolio d. Explain why the portfolio has a lower volatility than the average volatility of the two stocks Using your estimates from Problem 5, calculate the volatility (standard deviation) of a portfolio that is 70% invested in stock A and 30% invested in stock B. 1. For each company calculate: the expected returns it. the Variance the Standard deviation 2. For each company calculate and explain: The covariance ii. The correlation 3. Assuming you are an investor with GHS100 available. If you invest GHS60 and GHS40 in Allos Inc. and Orangus Inc. respectively, what will be your portfolio retums? 4. Calculate the Standard deviation of the portfolio i. Using the data in the following table, estimate (a) the average return and volatility for each stock, (b) the covariance between the stocks, and (c) the correlation between these two stocks Year 2007 2008 2009 2010 2011 2012 Stock A 10% 20% 5% 9% Stock B 21% 7% 30% 25% Use the data in Problems, consider a portfolio that maintains a 50% weight on stock A and a 50% weight on stock B. a. What is the return each year of this portfolio? b. Based on your results from part a, compute the average return and volatility of the portfolio d. Explain why the portfolio has a lower volatility than the average volatility of the two stocks Using your estimates from Problem 5, calculate the volatility (standard deviation) of a portfolio that is 70% invested in stock A and 30% invested in stock B. 1. For each company calculate: the expected returns it. the Variance the Standard deviation 2. For each company calculate and explain: The covariance ii. The correlation 3. Assuming you are an investor with GHS100 available. If you invest GHS60 and GHS40 in Allos Inc. and Orangus Inc. respectively, what will be your portfolio retums? 4. Calculate the Standard deviation of the portfolio
Step by Step Solution
There are 3 Steps involved in it

Get step-by-step solutions from verified subject matter experts