

Question: 11.7 Plotting Data Note: This problem will be graded as Challenge Activity and it will be graded manually. The attached graph.csv file contains lines with
11.7 Plotting Data
Note: This problem will be graded as Challenge Activity and it will be graded manually.
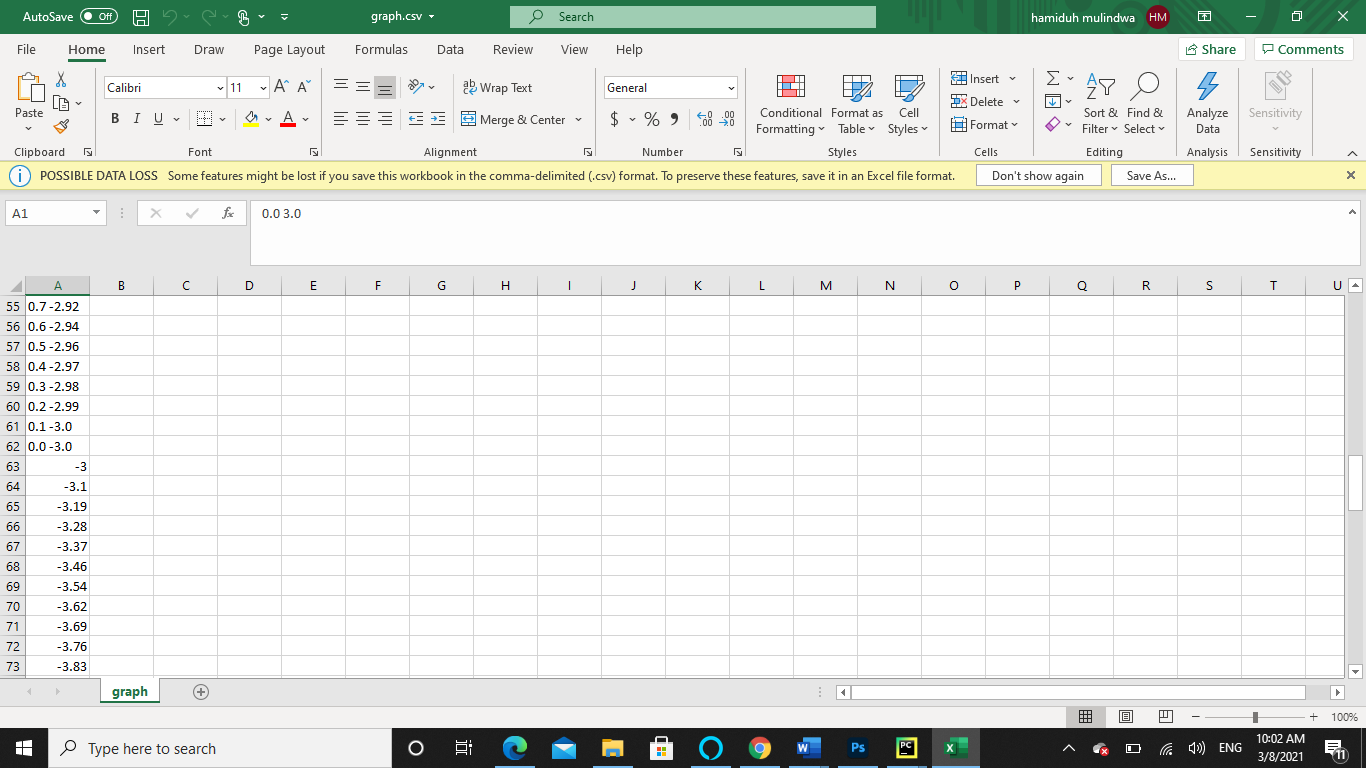
The attached graph.csv file contains lines with x and y coordinates of a graph. For example,
0.0 3.0 0.1 3.0 0.2 2.99 0.3 2.98 0.4 2.97 : :
Note: Please name the Python file plotting.py. The system will not accept any other name.
The first number and second number are x and y-coordinate of a point in Cartesian coordinate. Write a program to open and read the attached graph.csv file and plot the data.
Note, the graph.csv file is downloaded as zip file. Unzip it. Put it in the same directory where you write the program in PyCharm environment. You can copy the file in File Explorer and paste it in PyCharm.
Hint: Use the csv module to read the graph.csv. The data are string and they need to convert to float. Test your program before submitting it. There is no autograding for this.
301522.1819208.qx3zqy7
LAB ACTIVITY
11.7.1: Plotting Data
0 / 1
Submission Instructions
Downloadable files
graph.csv
Download
Upload your files below by dragging and dropping into the area or choosing a file on your hard drive.
plotting.py
Drag file hereorChoose on hard drive.
Submit for grading
Signature of your workWhat is this?
History of your effort will appear here once you begin working on this zyLab.
Latest submission
No submissions yet
AutoSave Off HD graph.csv Search hamiduh mulindwa HM 7 Share Comments AY o File Home Insert Draw Page Layout Formulas Data Review View Help Insert Calibri = 11 AA a Wrap Text General 9X Delete Paste BIU Cell F - 3 Merge & Center $ %, 809 Conditional Format as Sort & Find & .00 Formatting Table Styles Format Filter Select Clipboard Font Alignment Number Styles Cells Editing ( POSSIBLE DATA LOSS Some features might be lost if you save this workbook in the comma-delimited (.csv) format. To preserve these features, save it in an Excel file format. Don't show again Save As... WS s Analyze Sensitivity Data Analysis Sensitivity X A1 X fxx 0.0 3.0 B D E F G H 1 J K L M N O P Q R S T A 55 0.7-2.92 56 0.6-2.94 57 0.5-2.96 58 0.4-2.97 59 0.3-2.98 60 0.2-2.99 61 0.1-3.0 62 0.0-3.0 63 -3 64 -3.1 65 -3.19 66 -3.28 67 -3.37 68 -3.46 69 -3.54 70 -3.62 71 -3.69 72 -3.76 -3.83 73 graph + 100% Type here to search j 1 o e 1 E W Ps PC la ENG 10:02 AM 3/8/2021 AutoSave Off HD graph.csv Search hamiduh mulindwa HM 7 Share Comments AY o File Home Insert Draw Page Layout Formulas Data Review View Help Insert Calibri = 11 AA a Wrap Text General 9X Delete Paste BIU Cell F - 3 Merge & Center $ %, 809 Conditional Format as Sort & Find & .00 Formatting Table Styles Format Filter Select Clipboard Font Alignment Number Styles Cells Editing ( POSSIBLE DATA LOSS Some features might be lost if you save this workbook in the comma-delimited (.csv) format. To preserve these features, save it in an Excel file format. Don't show again Save As... WS s Analyze Sensitivity Data Analysis Sensitivity X A1 x fxx 0.0 3.0 A B D E F G H 1 J K L M N O P Q R S T 91 -3.88 92 -3.67 93 -3 94 -3.0 0.0 95 -2.9 0.77 96 -2.8 1.08 97 -2.7 1.31 98 -2.6 1.5 99 -2.5 1.66 100 -2.4 1.8 101 -2.3 1.93 102 -2.2 2.04 103 -2.1 2.14 104 -2.0 2.24 105 -1.9 2.32 106 -1.8 2.4 107 -1.7 2.47 108 -1.6 2.54 109 -1.5 2.6 graph + 100% Type here to search j o e 1 E W Ps PC la ENG 10:02 AM 3/8/2021
Step by Step Solution
There are 3 Steps involved in it

Get step-by-step solutions from verified subject matter experts