

Question: 12) Create a Pivot Table (shown below) a) Use the data from the Q10-12 worksheet (Columns A to M) to create a Pivot Table
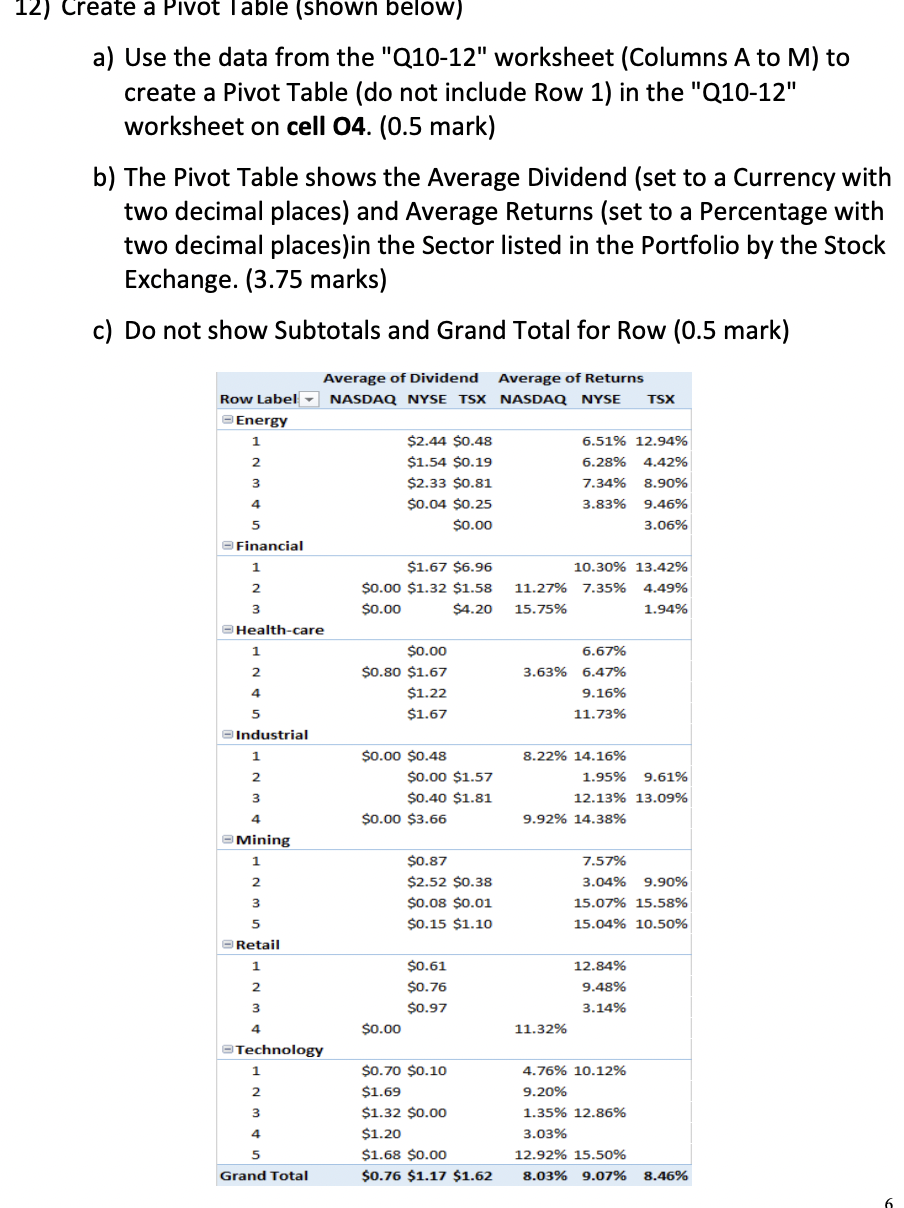
12) Create a Pivot Table (shown below) a) Use the data from the "Q10-12" worksheet (Columns A to M) to create a Pivot Table (do not include Row 1) in the "Q10-12" worksheet on cell 04. (0.5 mark) b) The Pivot Table shows the Average Dividend (set to a Currency with two decimal places) and Average Returns (set to a Percentage with two decimal places) in the Sector listed in the Portfolio by the Stock Exchange. (3.75 marks) c) Do not show Subtotals and Grand Total for Row (0.5 mark) Average of Returns NASDAQ NYSE TSX Average of Dividend Row Label NASDAQ NYSE TSX Energy 1 2 $2.44 $0.48 $1.54 $0.19 3 4 5 $2.33 $0.81 $0.04 $0.25 $0.00 6.51% 12.94% 6.28% 4.42% 7.34% 8.90% 3.83% 9.46% 3.06% Financial 1 $1.67 $6.96 2 3 $0.00 $1.32 $1.58 $0.00 $4.20 10.30% 13.42% 11.27% 7.35% 4.49% 15.75% 1.94% Health-care 1 $0.00 2 4 $0.80 $1.67 $1.22 6.67% 3.63% 6.47% 5 $1.67 9.16% 11.73% Industrial 1 $0.00 $0.48 8.22% 14.16% 2 $0.00 $1.57 1.95% 9.61% 3 $0.40 $1.81 12.13% 13.09% 4 $0.00 $3.66 9.92% 14.38% Mining 1 2 $0.87 $2.52 $0.38 7.57% 3.04% 9.90% 3 $0.08 $0.01 15.07% 15.58% 5 $0.15 $1.10 15.04% 10.50% Retail 1 $0.61 2 $0.76 12.84% 9.48% 3 $0.97 3.14% 4 $0.00 11.32% Technology 1 2 $0.70 $0.10 $1.69 4.76% 10.12% 9.20% 3 4 $1.32 $0.00 $1.20 1.35% 12.86% 5 Grand Total $1.68 $0.00 $0.76 $1.17 $1.62 3.03% 12.92% 15.50% 8.03% 9.07% 8.46%
Step by Step Solution
There are 3 Steps involved in it

Get step-by-step solutions from verified subject matter experts