

Question: 12 Suppose f(x) = (a) The rectangles in the graph on the left illustrate a left endpoint Riemann sum for f (x) on the interval


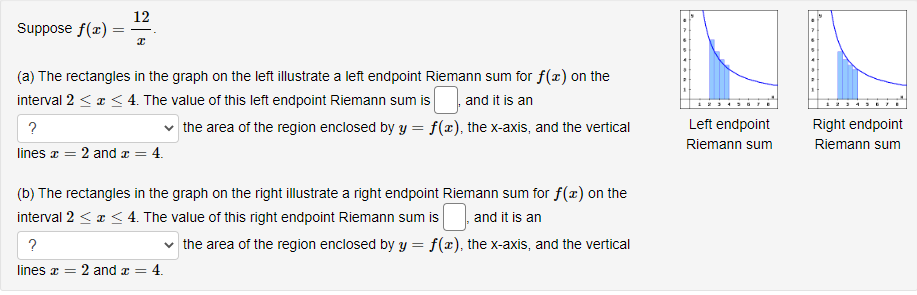

12 Suppose f(x) = (a) The rectangles in the graph on the left illustrate a left endpoint Riemann sum for f (x) on the interval 2
Step by Step Solution
There are 3 Steps involved in it
1 Expert Approved Answer
Step: 1 Unlock

Question Has Been Solved by an Expert!
Get step-by-step solutions from verified subject matter experts
Step: 2 Unlock
Step: 3 Unlock