

Question: 12. The 10% myth study discussed in this chapter measured the beliefs of both psychology majors and non- psychology majors. The 39 non-psychology majors in
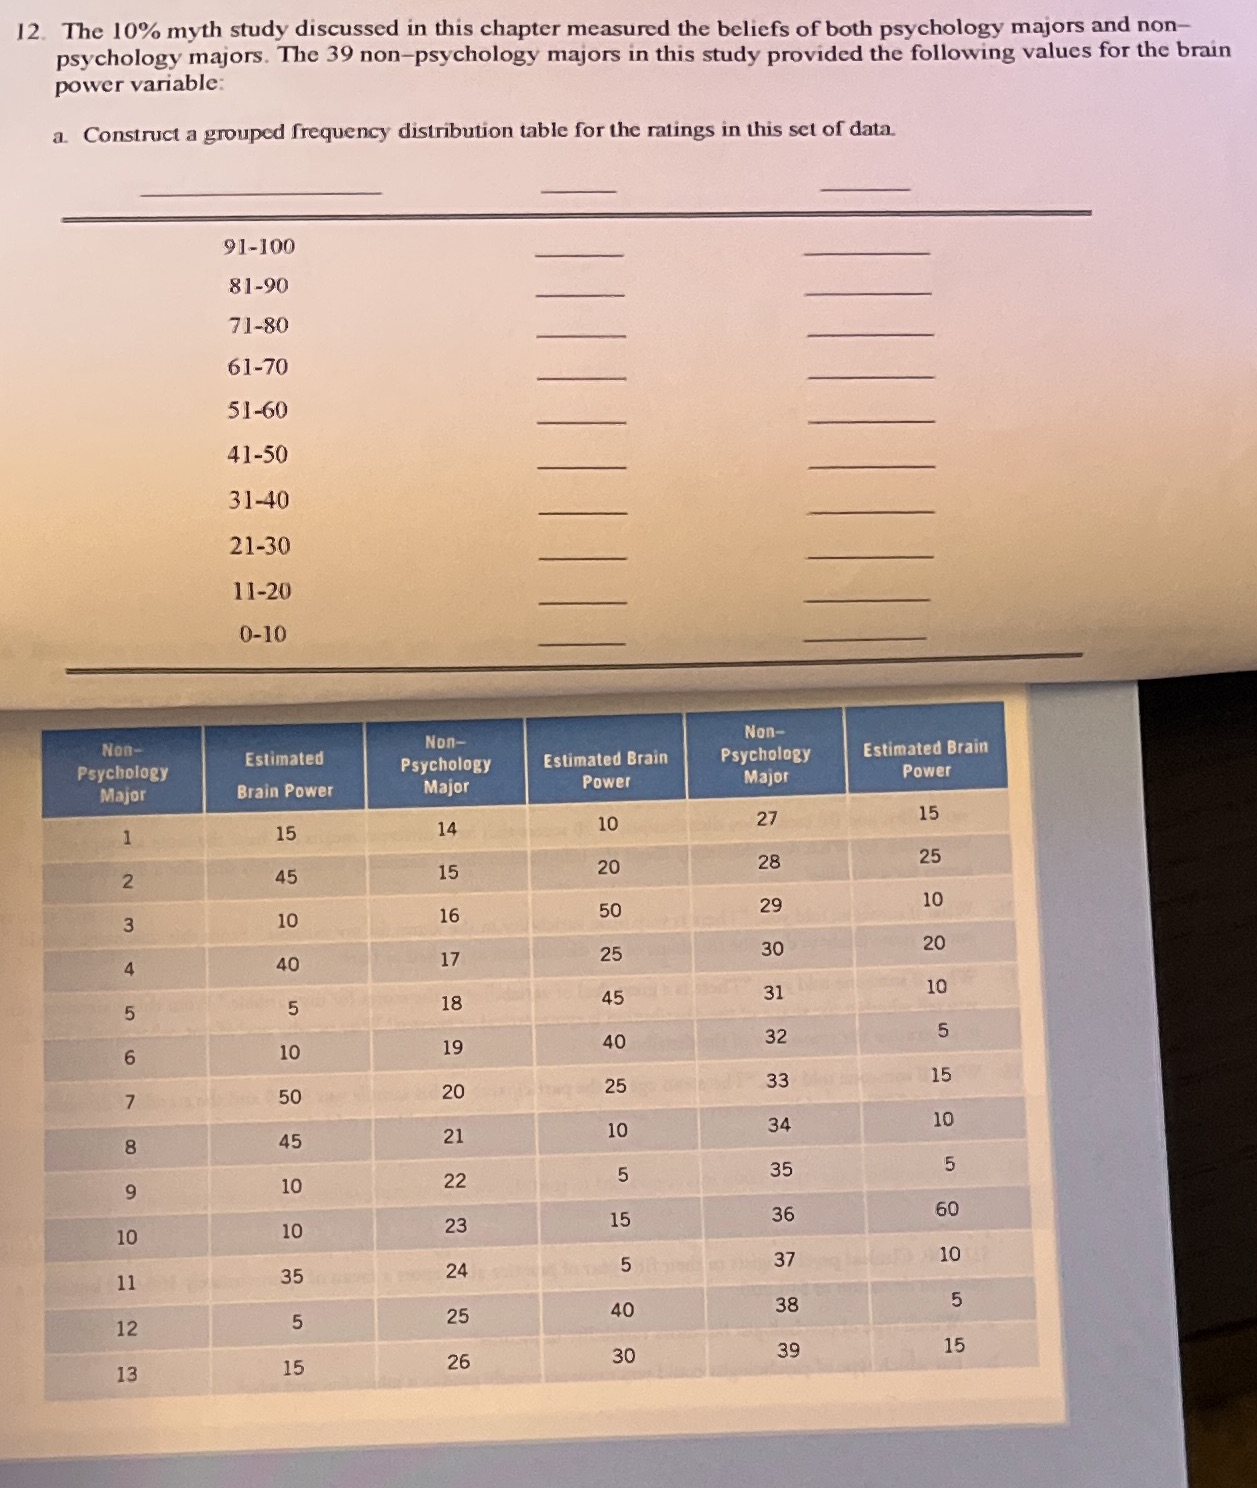
12. The 10% myth study discussed in this chapter measured the beliefs of both psychology majors and non- psychology majors. The 39 non-psychology majors in this study provided the following values for the brain power variable: a. Construct a grouped frequency distribution table for the ratings in this set of data. 91-100 81-90 71-80 61-70 51-60 41-50 31-40 21-30 11-20 0-10 Non- Non- Non- Psychology Estimated Psychology Estimated Brain Psychology Estimated Brain Brain Power Major Power Major Power Major 15 1 15 14 10 27 25 15 20 28 45 N 10 16 29 10 50 40 17 25 30 20 A 10 5 18 45 31 10 19 40 32 5 15 50 20 25 33 45 21 10 34 10 35 5 10 22 5 60 10 10 23 15 36 5 10 11 35 24 37 5 12 5 25 40 38 15 26 30 39 15 13
Step by Step Solution
There are 3 Steps involved in it

Get step-by-step solutions from verified subject matter experts