

Question: 12. The 10% myth study discussed in this chapter measured the beliefs of both psychology majors and non- psychology majors. The 39 non-psychology majors in
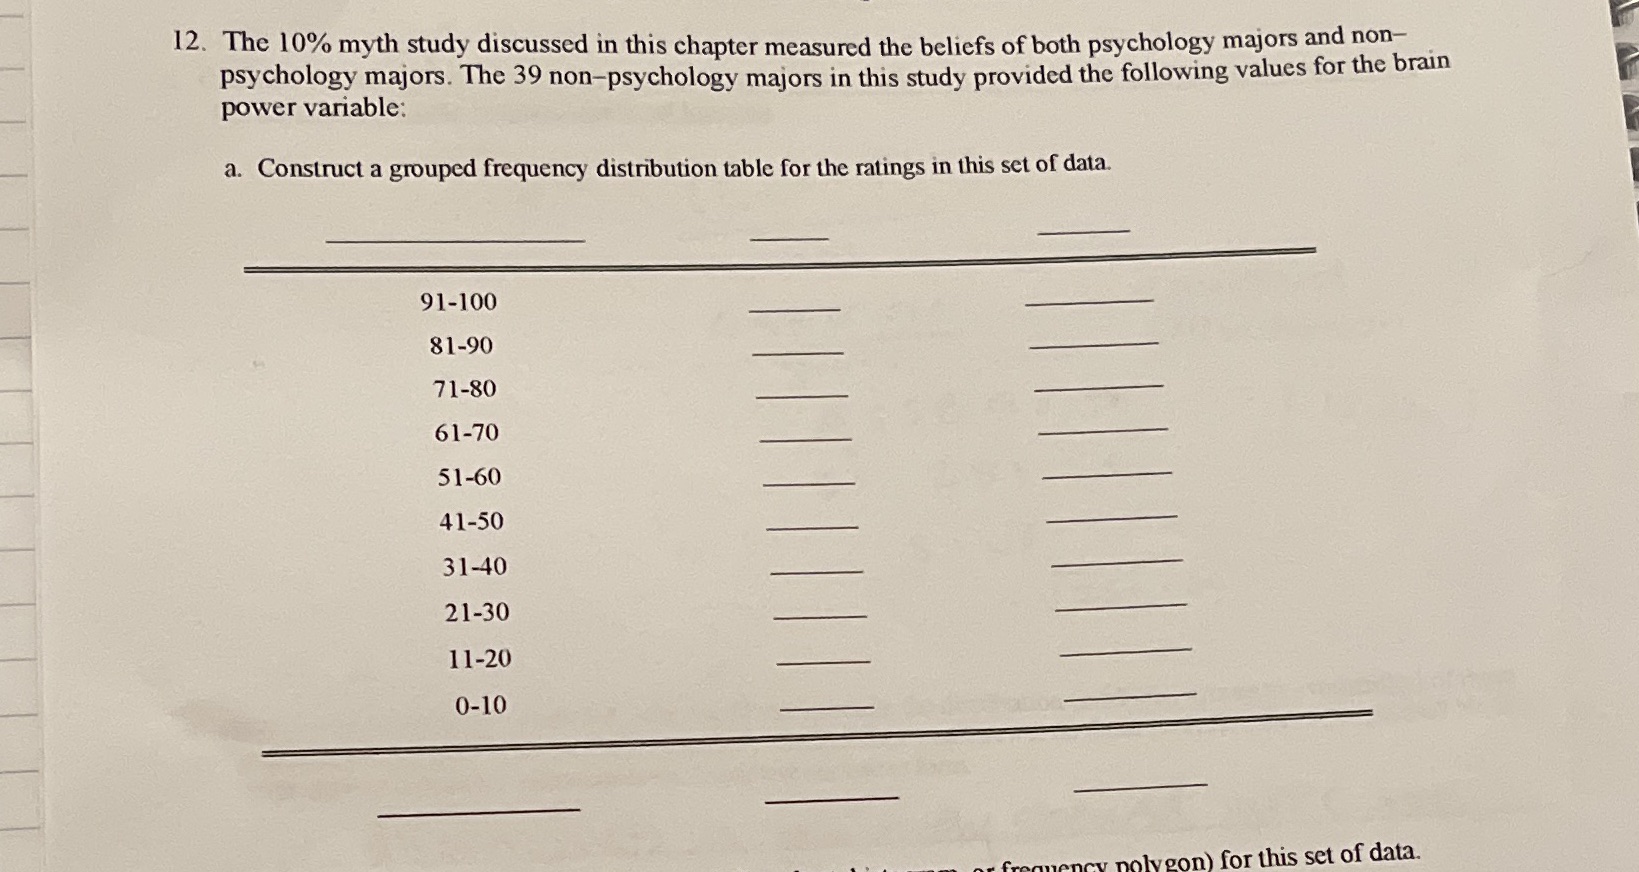
12. The 10% myth study discussed in this chapter measured the beliefs of both psychology majors and non- psychology majors. The 39 non-psychology majors in this study provided the following values for the brain power variable: a. Construct a grouped frequency distribution table for the ratings in this set of data. 91-100 81-90 71-80 61-70 51-60 41-50 31-40 21-30 11-20 0-10 polygon) for this set of data
Step by Step Solution
There are 3 Steps involved in it
1 Expert Approved Answer
Step: 1 Unlock

Question Has Been Solved by an Expert!
Get step-by-step solutions from verified subject matter experts
Step: 2 Unlock
Step: 3 Unlock