

Question: the 12. (This example was introduced in Chapter 3.) The 10% myth study discussed in this chapter measured the beliefs of both psychology majors and
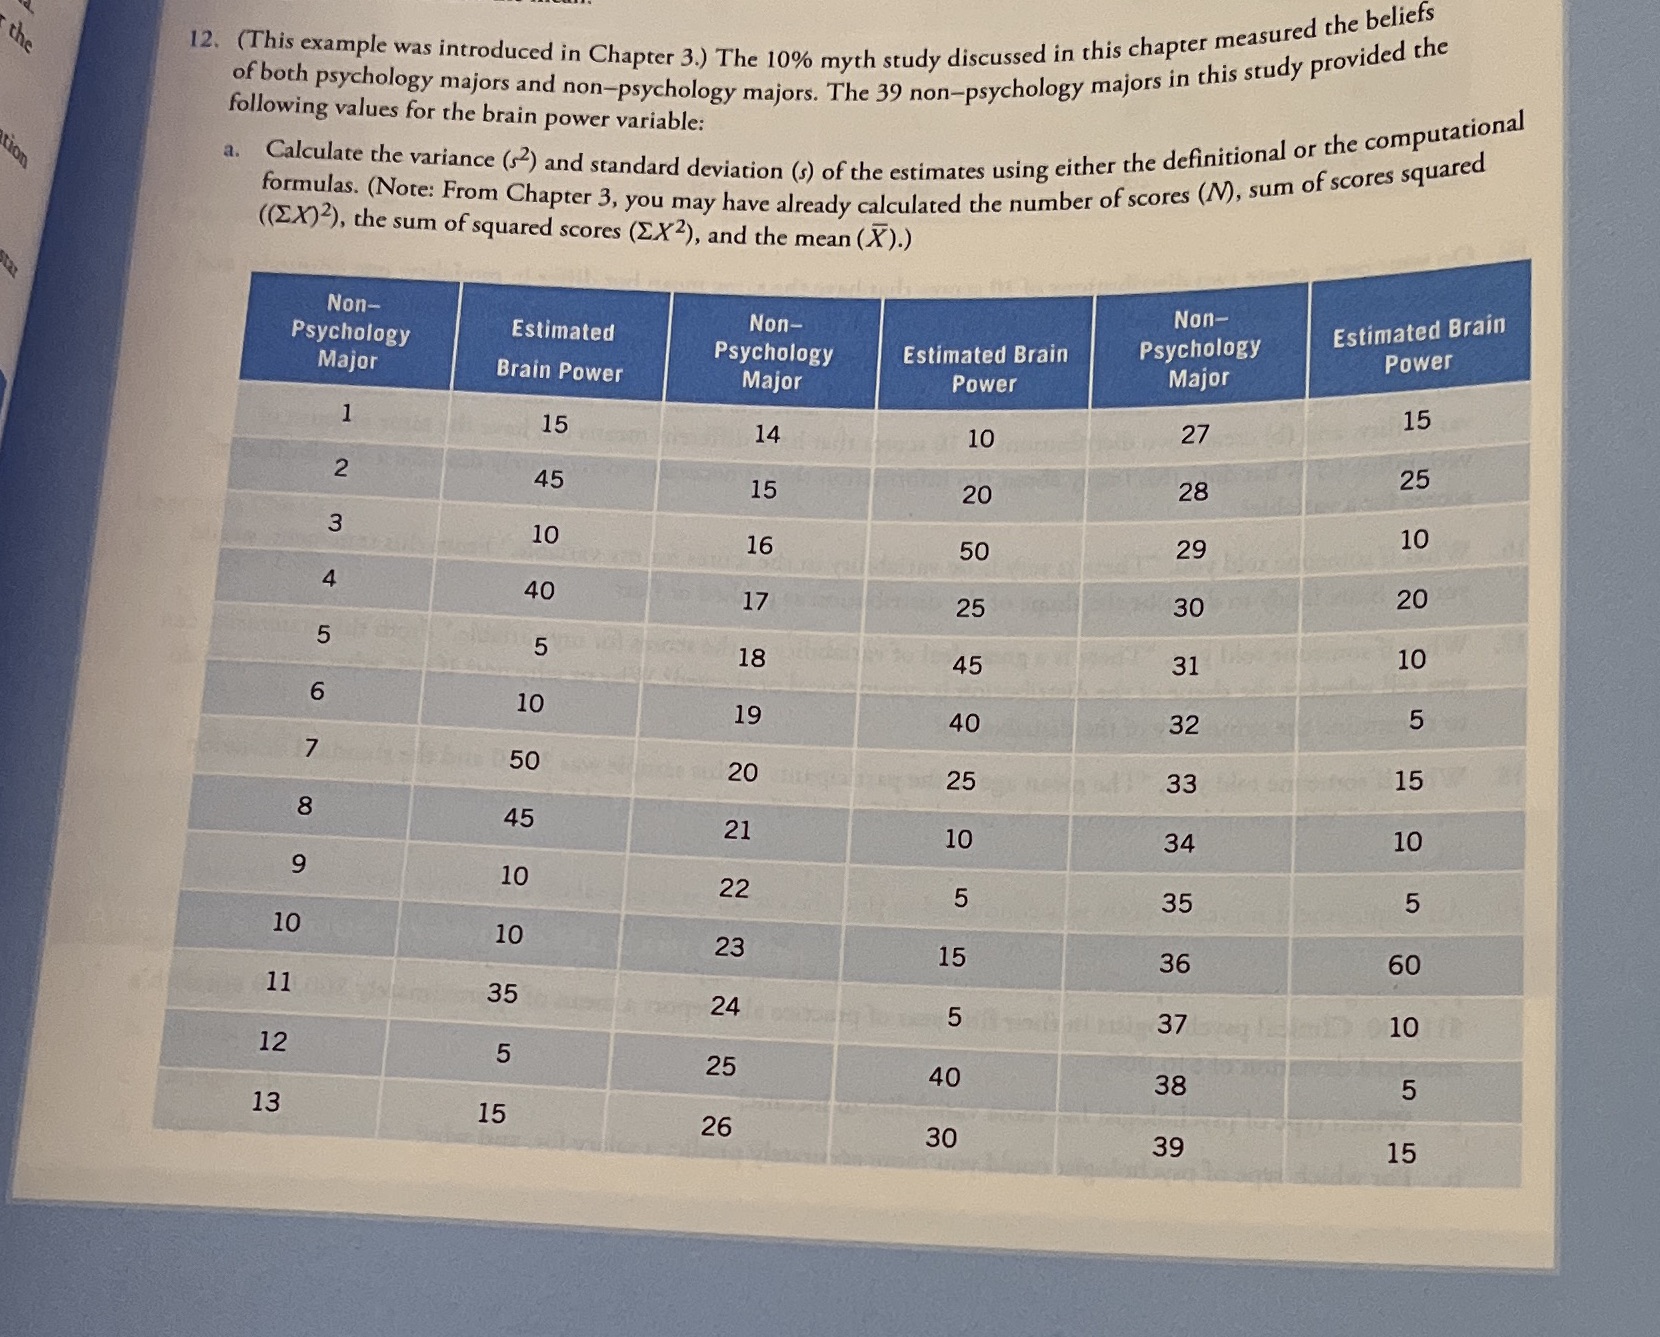
the 12. (This example was introduced in Chapter 3.) The 10% myth study discussed in this chapter measured the beliefs of both psychology majors and non-psychology majors. The 39 non-psychology majors in this study provided the following values for the brain power variable: tion a. Calculate the variance (s2) and standard deviation (s) of the estimates using either the definitional or the computational formulas. (Note: From Chapter 3, you may have already calculated the number of scores (M), sum of scores squared ((EX)2), the sum of squared scores (EX2), and the mean (X).) Non- Non- Estimated Brain Psychology Estimated Non- Psychology Psychology Estimated Brain Power Major Brain Power Major Power Major 15 15 14 10 27 25 2 45 15 20 28 10 3 10 16 50 29 20 A 40 17 25 30 5 18 31 10 45 5 10 19 40 32 50 33 15 20 25 8 45 21 34 10 10 10 22 5 35 5 10 10 23 15 36 60 11 35 24 5 37 10 12 5 25 40 38 5 13 15 26 30 39 15
Step by Step Solution
There are 3 Steps involved in it

Get step-by-step solutions from verified subject matter experts