

Question: 12. The cable below gives data on the monthly returns on the S&P 500 and small-cap stocks for the period January 1960 through December 1999

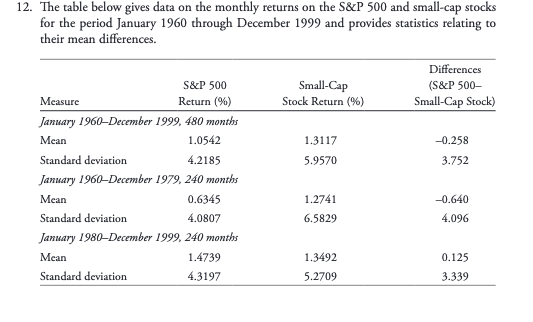
12. The cable below gives data on the monthly returns on the S&P 500 and small-cap stocks for the period January 1960 through December 1999 and provides statistics relating to their mean differences. Differences S&P 500 Small-Cap (S&P 500- Measure Return (9%) Stock Return (9%) Small-Cap Stock) January 1960-December 1999, 480 months Mean 1.0542 1.3117 -0.258 Standard deviation 4.2185 5.9570 3.752 January 1960-December 1979, 240 months Mean 0.6345 1.2741 -0.640 Standard deviation 4.0807 6.5829 4.096 January 1980-December 1999, 240 months Mean 1.4739 1.3492 0.125 Standard deviation 4.3197 5.2709 3.339
Step by Step Solution
There are 3 Steps involved in it
1 Expert Approved Answer
Step: 1 Unlock

Question Has Been Solved by an Expert!
Get step-by-step solutions from verified subject matter experts
Step: 2 Unlock
Step: 3 Unlock