

Question: The table below gives data on the monthly returns on the S&P 500 and small-cap stocks for a forty-year period and provides statistics relating to
The table below gives data on the monthly returns on the S&P 500 and small-cap stocks for a forty-year period and provides statistics relating to their mean differences. Furthermore, the entire sample period is split into two subperiods of 20 years each and the returns data for these subperiods is also given in the table.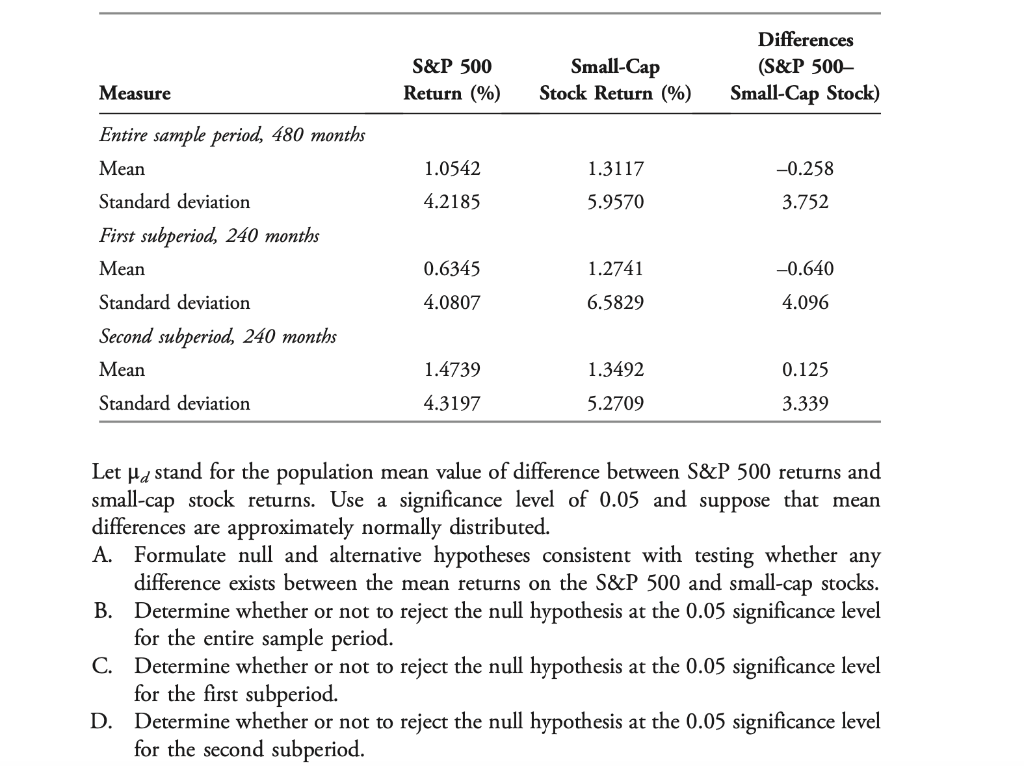
Let d stand for the population mean value of difference between S\&P 500 returns and small-cap stock returns. Use a significance level of 0.05 and suppose that mean differences are approximately normally distributed. A. Formulate null and alternative hypotheses consistent with testing whether any difference exists between the mean returns on the S\&P 500 and small-cap stocks. B. Determine whether or not to reject the null hypothesis at the 0.05 significance level for the entire sample period. C. Determine whether or not to reject the null hypothesis at the 0.05 significance level for the first subperiod. D. Determine whether or not to reject the null hypothesis at the 0.05 significance level for the second subperiod
Step by Step Solution
There are 3 Steps involved in it

Get step-by-step solutions from verified subject matter experts