

Question: (1.23 Complete the data table in the What-if Analysis section of the worksheet to compute the Net Profit for various values of attendance and the
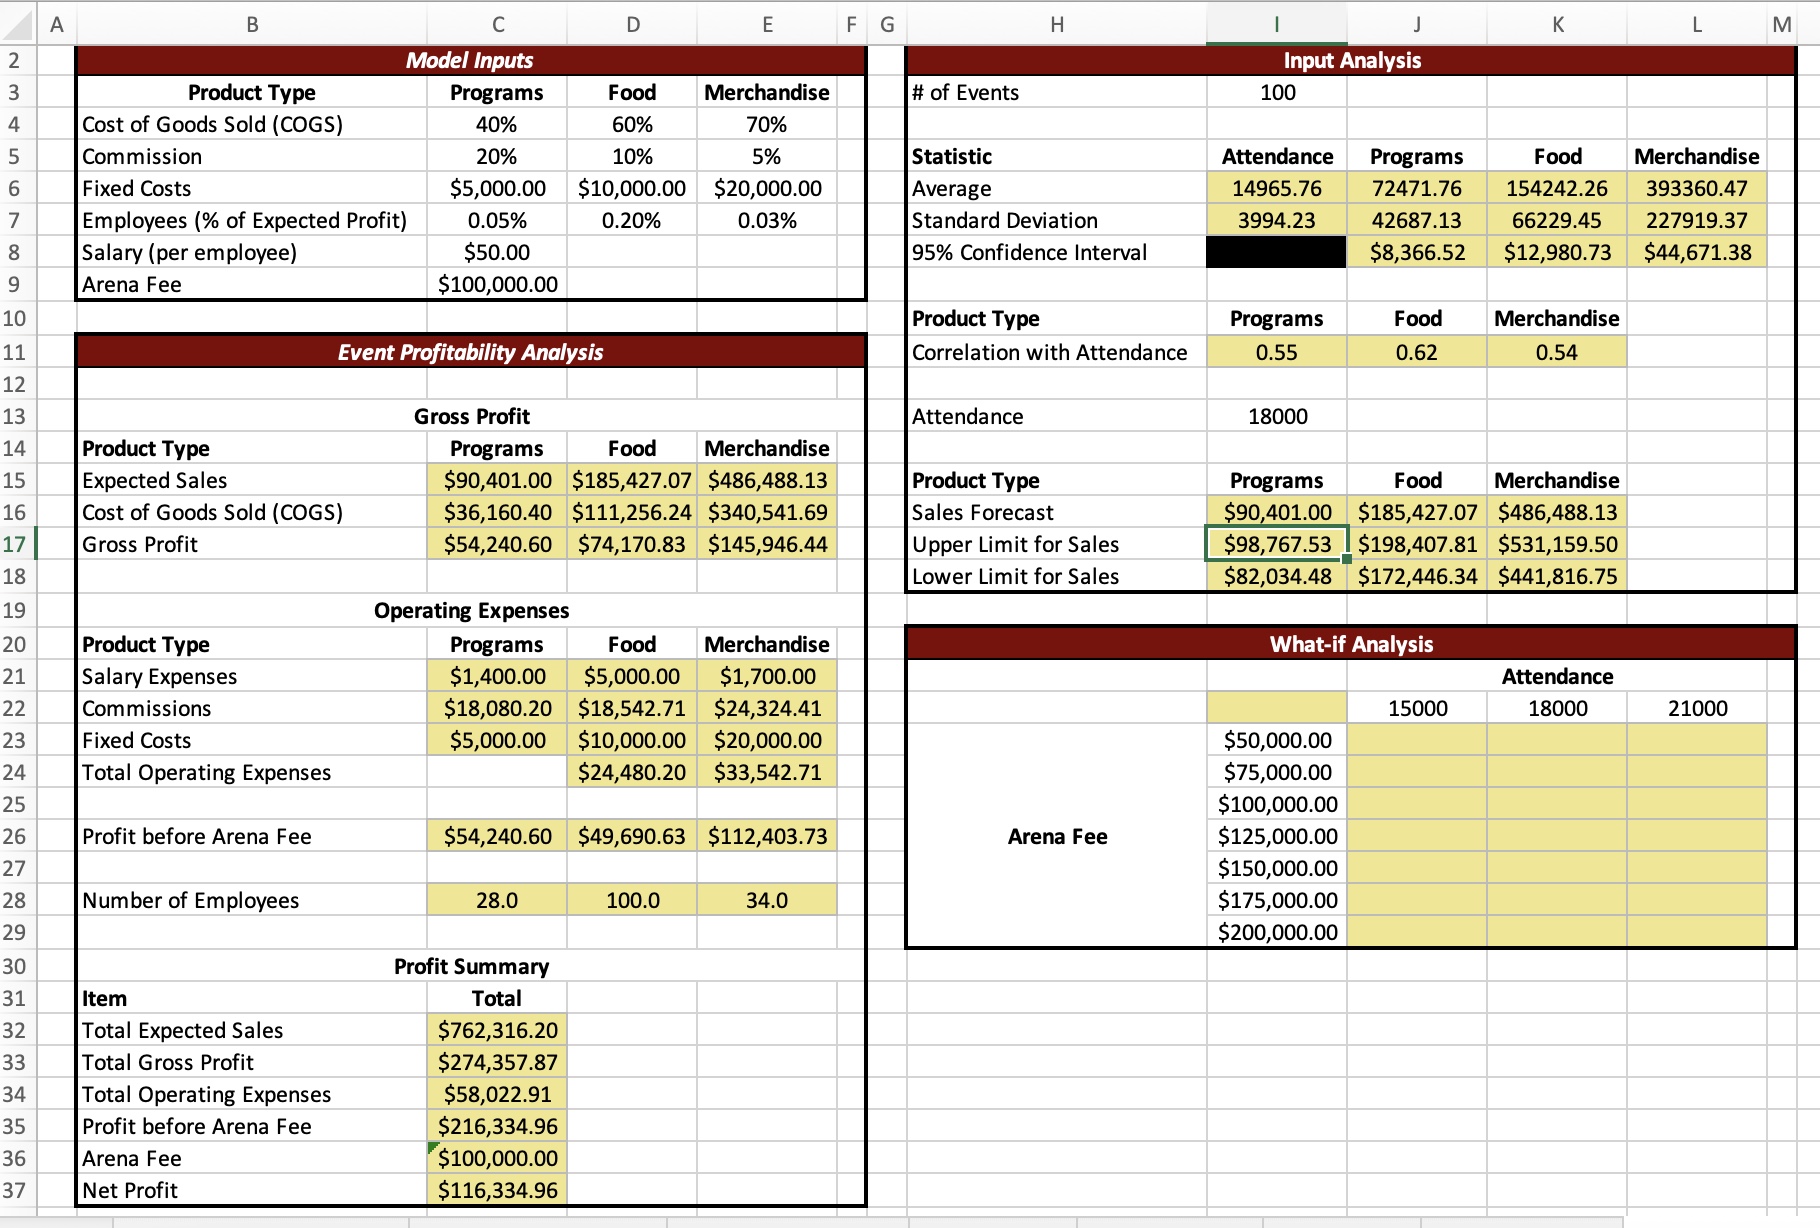
(1.23 Complete the data table in the "What-if Analysis" section of the worksheet to compute the Net Profit for various values of attendance and the Arena Fee. \begin{tabular}{|l|c|c|c|} \hline \multicolumn{4}{|c|}{ Model Inputs } \\ \hline \multicolumn{1}{|c|}{ Product Type } & Programs & Food & Merchandise \\ \hline Cost of Goods Sold (COGS) & 40% & 60% & 70% \\ \hline Commission & 20% & 10% & 5% \\ \hline Fixed Costs & $5,000.00 & $10,000.00 & $20,000.00 \\ \hline Employees (\% of Expected Profit) & 0.05% & 0.20% & 0.03% \\ \hline Salary (per employee) & $50.00 & & \\ \hline Arena Fee & $100,000.00 & & \\ \hline \end{tabular} Event Profitability Analysis \begin{tabular}{|c|c|c|c|} \hline \multicolumn{4}{|c|}{ Gross Profit } \\ \hline Product Type & Programs & Food & Merchandise \\ \hline Expected Sales & $90,401.00 & $185,427.07 & $486,488.13 \\ \hline Cost of Goods Sold (COGS) & $36,160.40 & $111,256.24 & $340,541.69 \\ \hline Gross Profit & $54,240.60 & $74,170.83 & $145,946.44 \\ \hline \multicolumn{4}{|c|}{ Operating Expenses } \\ \hline Product Type & Programs & Food & Merchandise \\ \hline Salary Expenses & $1,400.00 & $5,000.00 & $1,700.00 \\ \hline Commissions & $18,080.20 & $18,542.71 & $24,324.41 \\ \hline Fixed Costs & $5,000.00 & $10,000.00 & $20,000.00 \\ \hline Total Operating Expenses & & $24,480.20 & $33,542.71 \\ \hline Profit before Arena Fee & $54,240.60 & $49,690.63 & $112,403.73 \\ \hline Number of Employees & 28.0 & 100.0 & 34.0 \\ \hline \multicolumn{4}{|c|}{ Profit Summary } \\ \hline Item & Total & & \\ \hline Total Expected Sales & $762,316.20 & & \\ \hline Total Gross Profit & $274,357.87 & & \\ \hline Total Operating Expenses & $58,022.91 & & \\ \hline Profit before Arena Fee & $216,334.96 & & \\ \hline Arena Fee & $100,000.00 & & \\ \hline Net Profit & $116,334.96 & & \\ \hline \end{tabular} \begin{tabular}{|c|c|c|c|c|} \hline \multicolumn{5}{|c|}{ Input Analysis } \\ \hline \# of Events & 100 & & & \\ \hline Statistic & Attendance & Programs & Food & Merchandise \\ \hline Average & 14965.76 & 72471.76 & 154242.26 & 393360.47 \\ \hline Standard Deviation & 3994.23 & 42687.13 & 66229.45 & 227919.37 \\ \hline 95\% Confidence Interval & & $8,366.52 & $12,980.73 & $44,671.38 \\ \hline Product Type & Programs & Food & Merchandise & \\ \hline Correlation with Attendance & 0.55 & 0.62 & 0.54 & \\ \hline Attendance & 18000 & & & \\ \hline Product Type & Programs & Food & Merchandise & \\ \hline Sales Forecast & $90,401.00 & $185,427.07 & $486,488.13 & \\ \hline Upper Limit for Sales & $98,767.53 & $198,407.81 & $531,159.50 & \\ \hline Lower Limit for Sales & $82,034.48 & $172,446.34 & $441,816.75 & \\ \hline \multicolumn{5}{|c|}{ What-if Analysis } \\ \hline & & \multicolumn{3}{|c|}{ Attendance } \\ \hline & & 15000 & 18000 & 21000 \\ \hline \multirow{7}{*}{ Arena Fee } & $50,000.00 & & & \\ \hline & $75,000.00 & & & \\ \hline & $100,000.00 & & & \\ \hline & $125,000.00 & & & \\ \hline & $150,000.00 & & & \\ \hline & $175,000.00 & & & \\ \hline & $200,000.00 & & & \\ \hline \end{tabular}
Step by Step Solution
There are 3 Steps involved in it

Get step-by-step solutions from verified subject matter experts