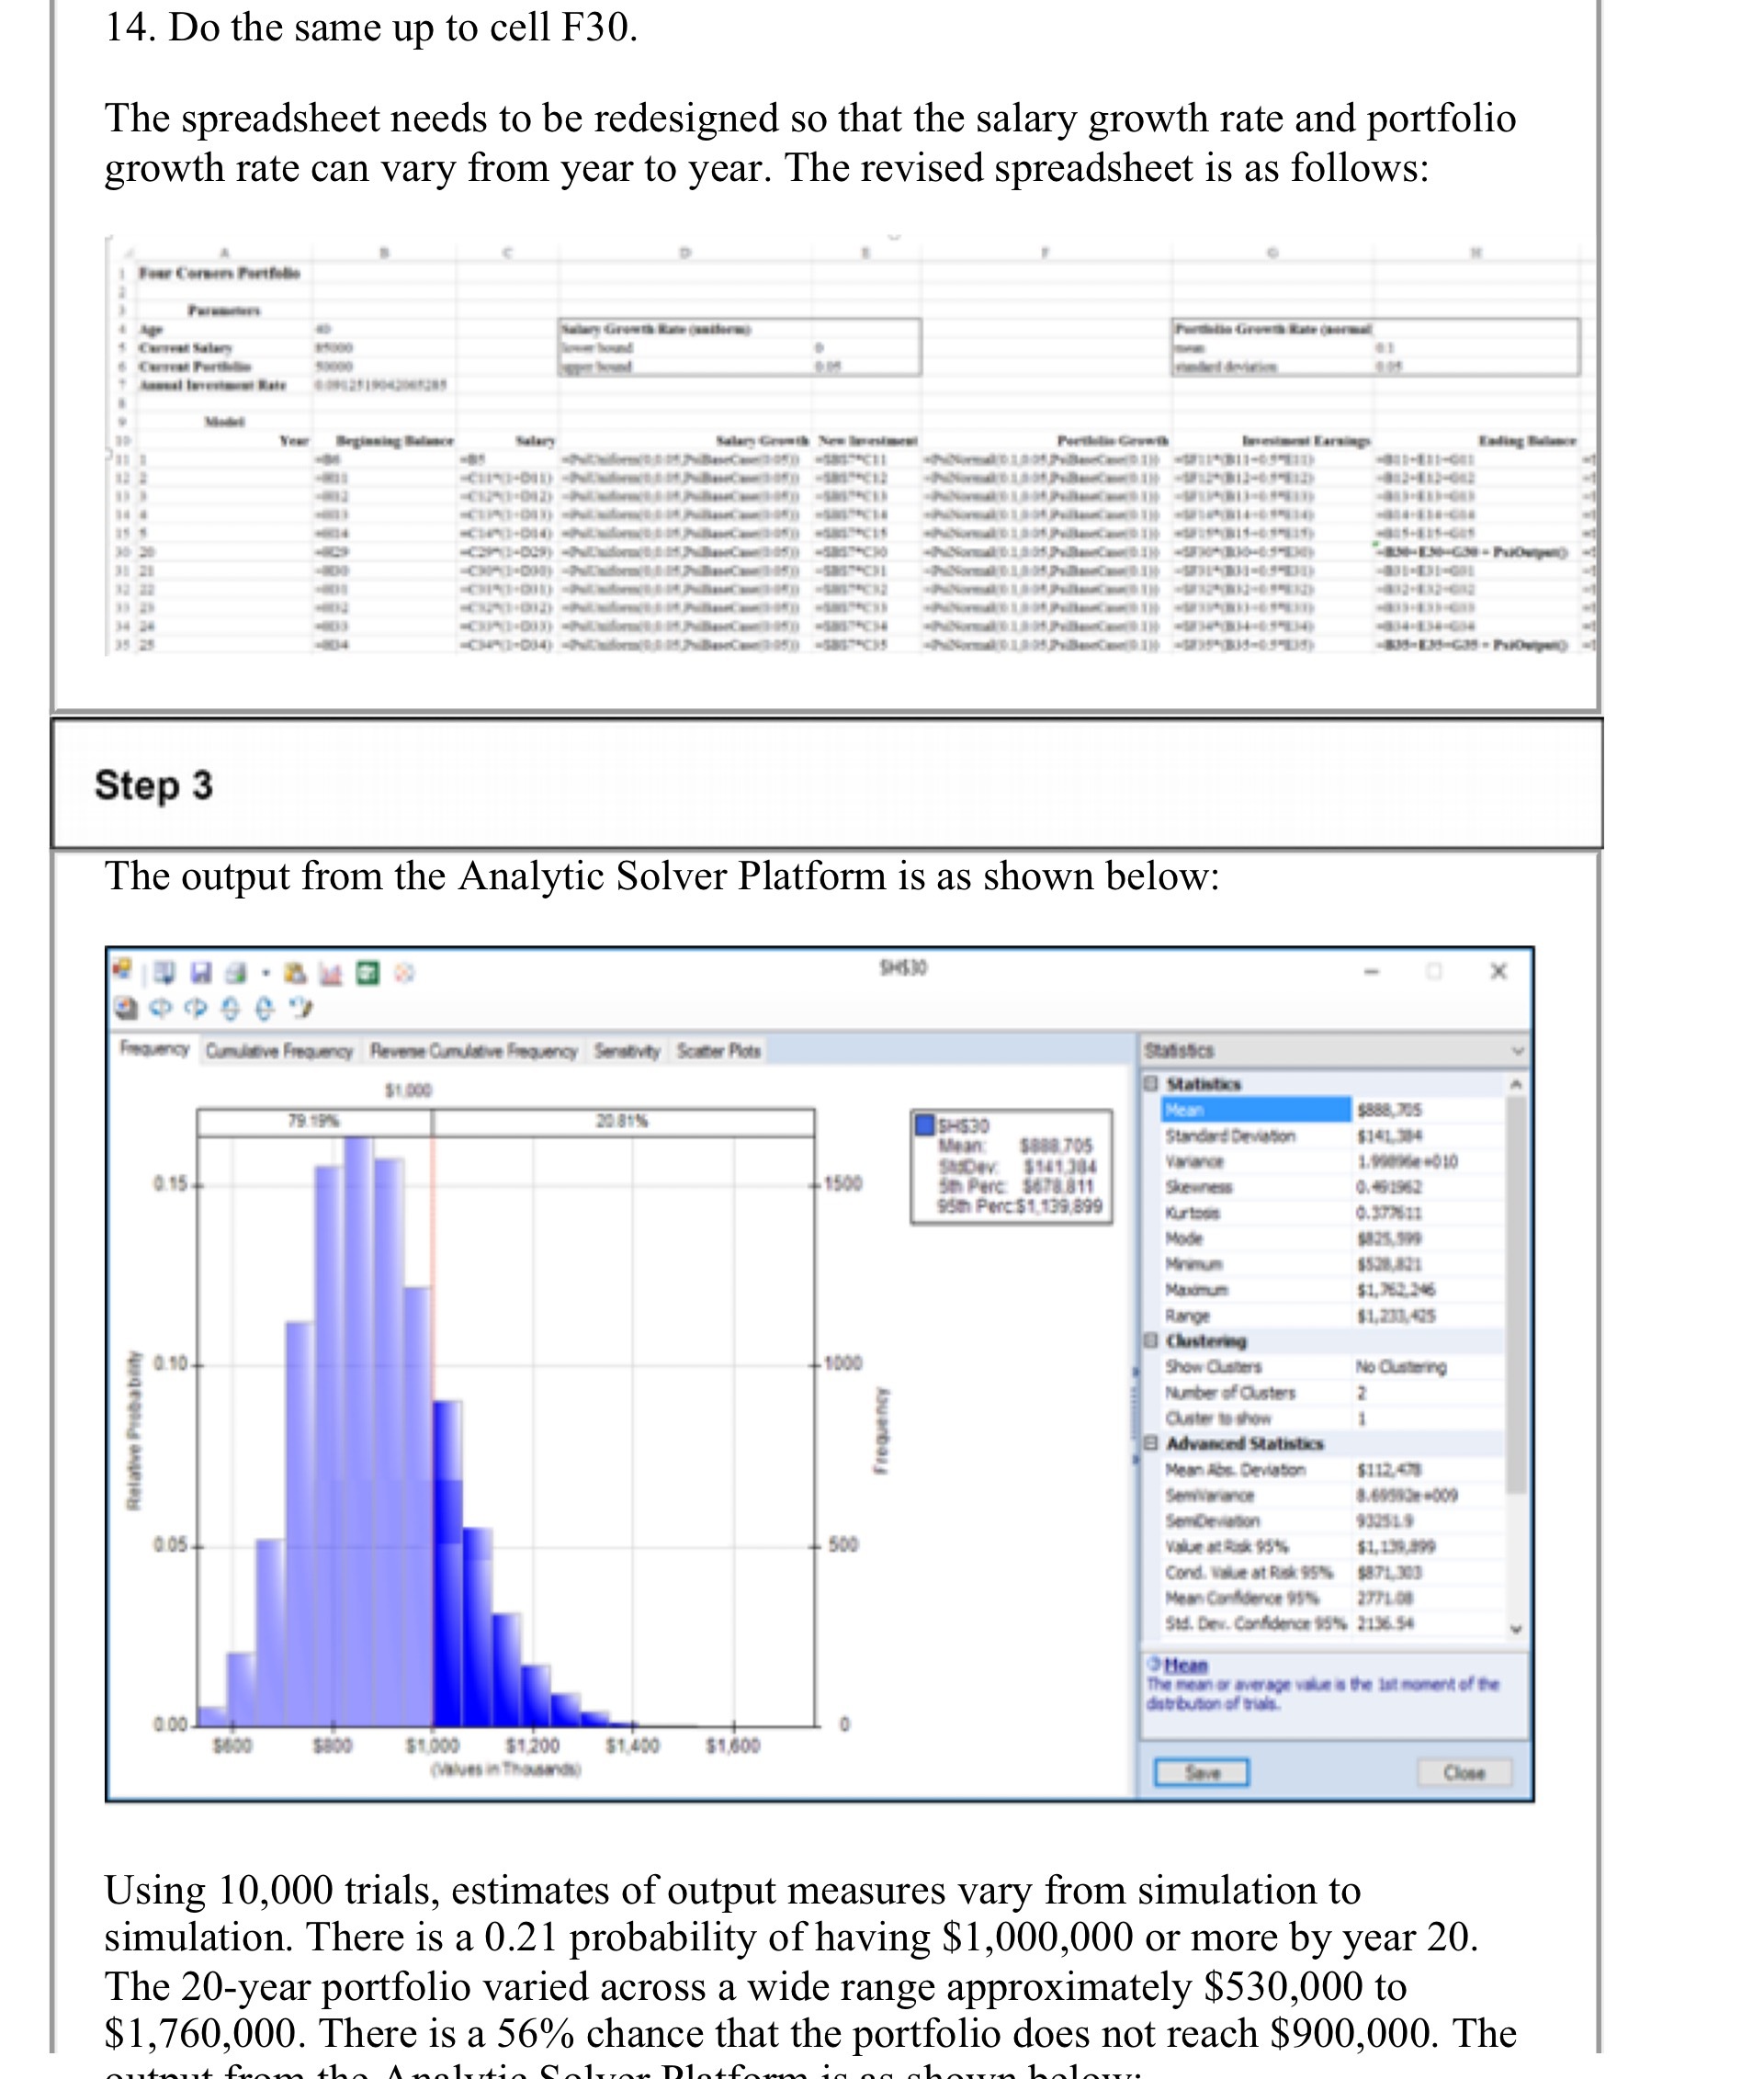
Question: 14. Do the same up to cell F30. The spreadsheet needs to be redesigned so that the salary growth rate and portfolio growth rate can

14. Do the same up to cell F30. The spreadsheet
14. Do the same up to cell F30. The spreadsheet needs to be redesigned so that the salary growth rate and portfolio growth rate can vary from year to year. The revised spreadsheet is as follows: Four Corson Portfolle Step 3 The output from the Analytic Solver Platform is as shown below: Frequency Cumulative Frequency Reverse Cumulative Frequency Senativity Scatter Plots Statistics Statistics 79 19% 20 815 SHS3 $868,705 Mean $888 705 Standard Deviation $141.304 1500 $141 304 1.99096e-010 0.15 5m Perc: $678 811 soness 0.461962 95th Perc $1,139,899 0.372612 Maximum $1,762.246 Range $1,230,435 B Clustering 0.10 1000 Show Clusters No Clustering Number of Ousters Cluster to show Relative Prebabaity Frequency Advanced Statistics Mean Abs. Deviation $112470 SemiNer ance 8.68580e -009 93051.9 0 05 . 500 $1,139,499 Cond. Value at Risk 95%% 5871,300 Mean Canidence 95% Sid. Dew. Confidence 151% 2136.54 Hean The mean or average value is the lut moment of the date bution of trish 0.00- $800 $800 $1,000 $1,200 $1,400 $1,600 (Values in Thousands) Close Using 10,000 trials, estimates of output measures vary from simulation to simulation. There is a 0.21 probability of having $1,000,000 or more by year 20. The 20-year portfolio varied across a wide range approximately $530,000 to $1,760,000. There is a 56% chance that the portfolio does not reach $900,000. The

Step by Step Solution

There are 3 Steps involved in it

1 Expert Approved Answer
Step: 1 Unlock blur-text-image
Question Has Been Solved by an Expert!

Get step-by-step solutions from verified subject matter experts

Step: 2 Unlock
Step: 3 Unlock

Students Have Also Explored These Related Accounting Questions!