

Question: 1:48 Lesson 7.2 - AP Stats -... .. AP Statistics Exam SECTION I: Multiple Choice AP Stats Exam Scores - Day 2 AP Statistics
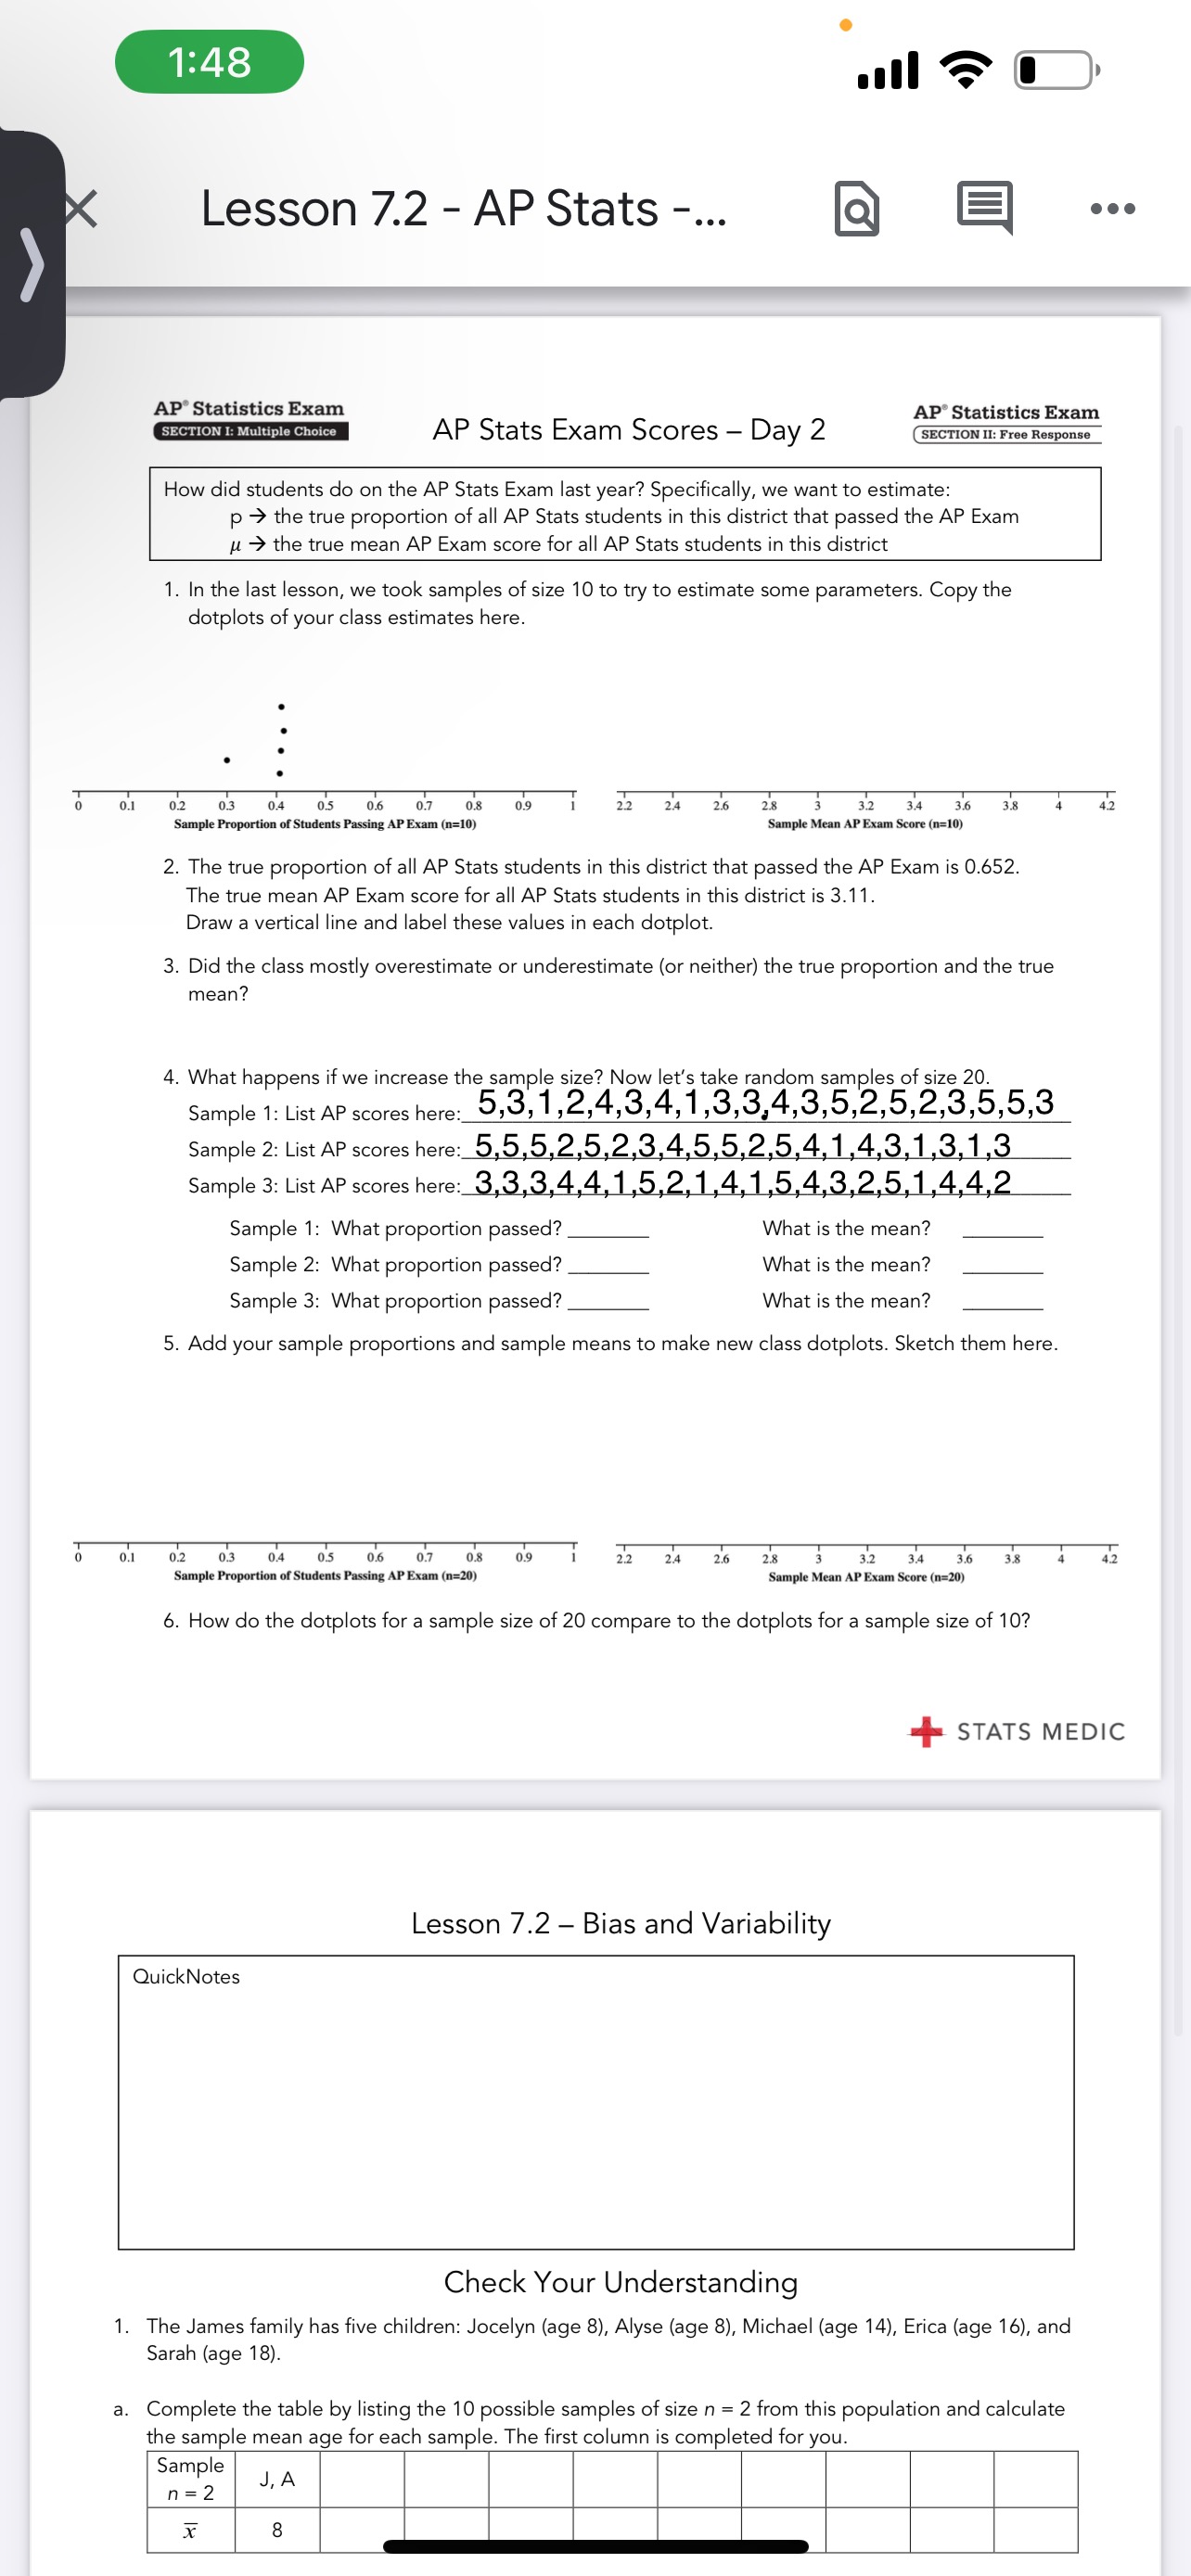
1:48 Lesson 7.2 - AP Stats -... .. AP Statistics Exam SECTION I: Multiple Choice AP Stats Exam Scores - Day 2 AP Statistics Exam SECTION II: Free Response How did students do on the AP Stats Exam last year? Specifically, we want to estimate: p u the true proportion of all AP Stats students in this district that passed the AP Exam the true mean AP Exam score for all AP Stats students in this district 1. In the last lesson, we took samples of size 10 to try to estimate some parameters. Copy the dotplots of your class estimates here. 0 0.1 0.2 0.3 0.4 0.5 0.6 0.7 0.8 0.9 Sample Proportion of Students Passing AP Exam (n=10) 2.4 2.6 2.8 3.2 3.4 3.6 3.8 4 4.2 Sample Mean AP Exam Score (n=10) 2. The true proportion of all AP Stats students in this district that passed the AP Exam is 0.652. The true mean AP Exam score for all AP Stats students in this district is 3.11. Draw a vertical line and label these values in each dotplot. 3. Did the class mostly overestimate or underestimate (or neither) the true proportion and the true mean? 4. What happens if we increase the sample size? Now let's take random samples of size 20. Sample 1: List AP scores here: 5,3,1,2,4,3,4,1,3,3,4,3,5,2,5,2,3,5,5,3 Sample 2: List AP scores here: 5,5,5,2,5,2,3,4,5,5,2,5,4,1,4,3,1,3,13 Sample 3: List AP scores here: 3,3,3,4,4,1,5,2,1,4,1,5,4,3,2,5,1,4,4,2 Sample 1: What proportion passed? Sample 2: What proportion passed? Sample 3: What proportion passed? What is the mean? What is the mean? What is the mean? 5. Add your sample proportions and sample means to make new class dotplots. Sketch them here. 0 0.1 0.2 0.3 0.4 0.5 0.6 Sample Proportion of Students Passing AP Exam (n=20) 0.7 0.8 0.9 1 2.4 2.6 2.8 3 3.2 3.4 3.6 3.8 4 4.2 Sample Mean AP Exam Score (n=20) 6. How do the dotplots for a sample size of 20 compare to the dotplots for a sample size of 10? Lesson 7.2 - Bias and Variability QuickNotes + STATS MEDIC Check Your Understanding 1. The James family has five children: Jocelyn (age 8), Alyse (age 8), Michael (age 14), Erica (age 16), and Sarah (age 18). a. Complete the table by listing the 10 possible samples of size n = 2 from this population and calculate the sample mean age for each sample. The first column is completed for you. Sample J, A n = 2 X 8
Step by Step Solution
There are 3 Steps involved in it

Get step-by-step solutions from verified subject matter experts