

Question: Activity 1: Where Do I Stand? ORIEEE How does my height compare with the other AP Stats students in my class? In order to answer

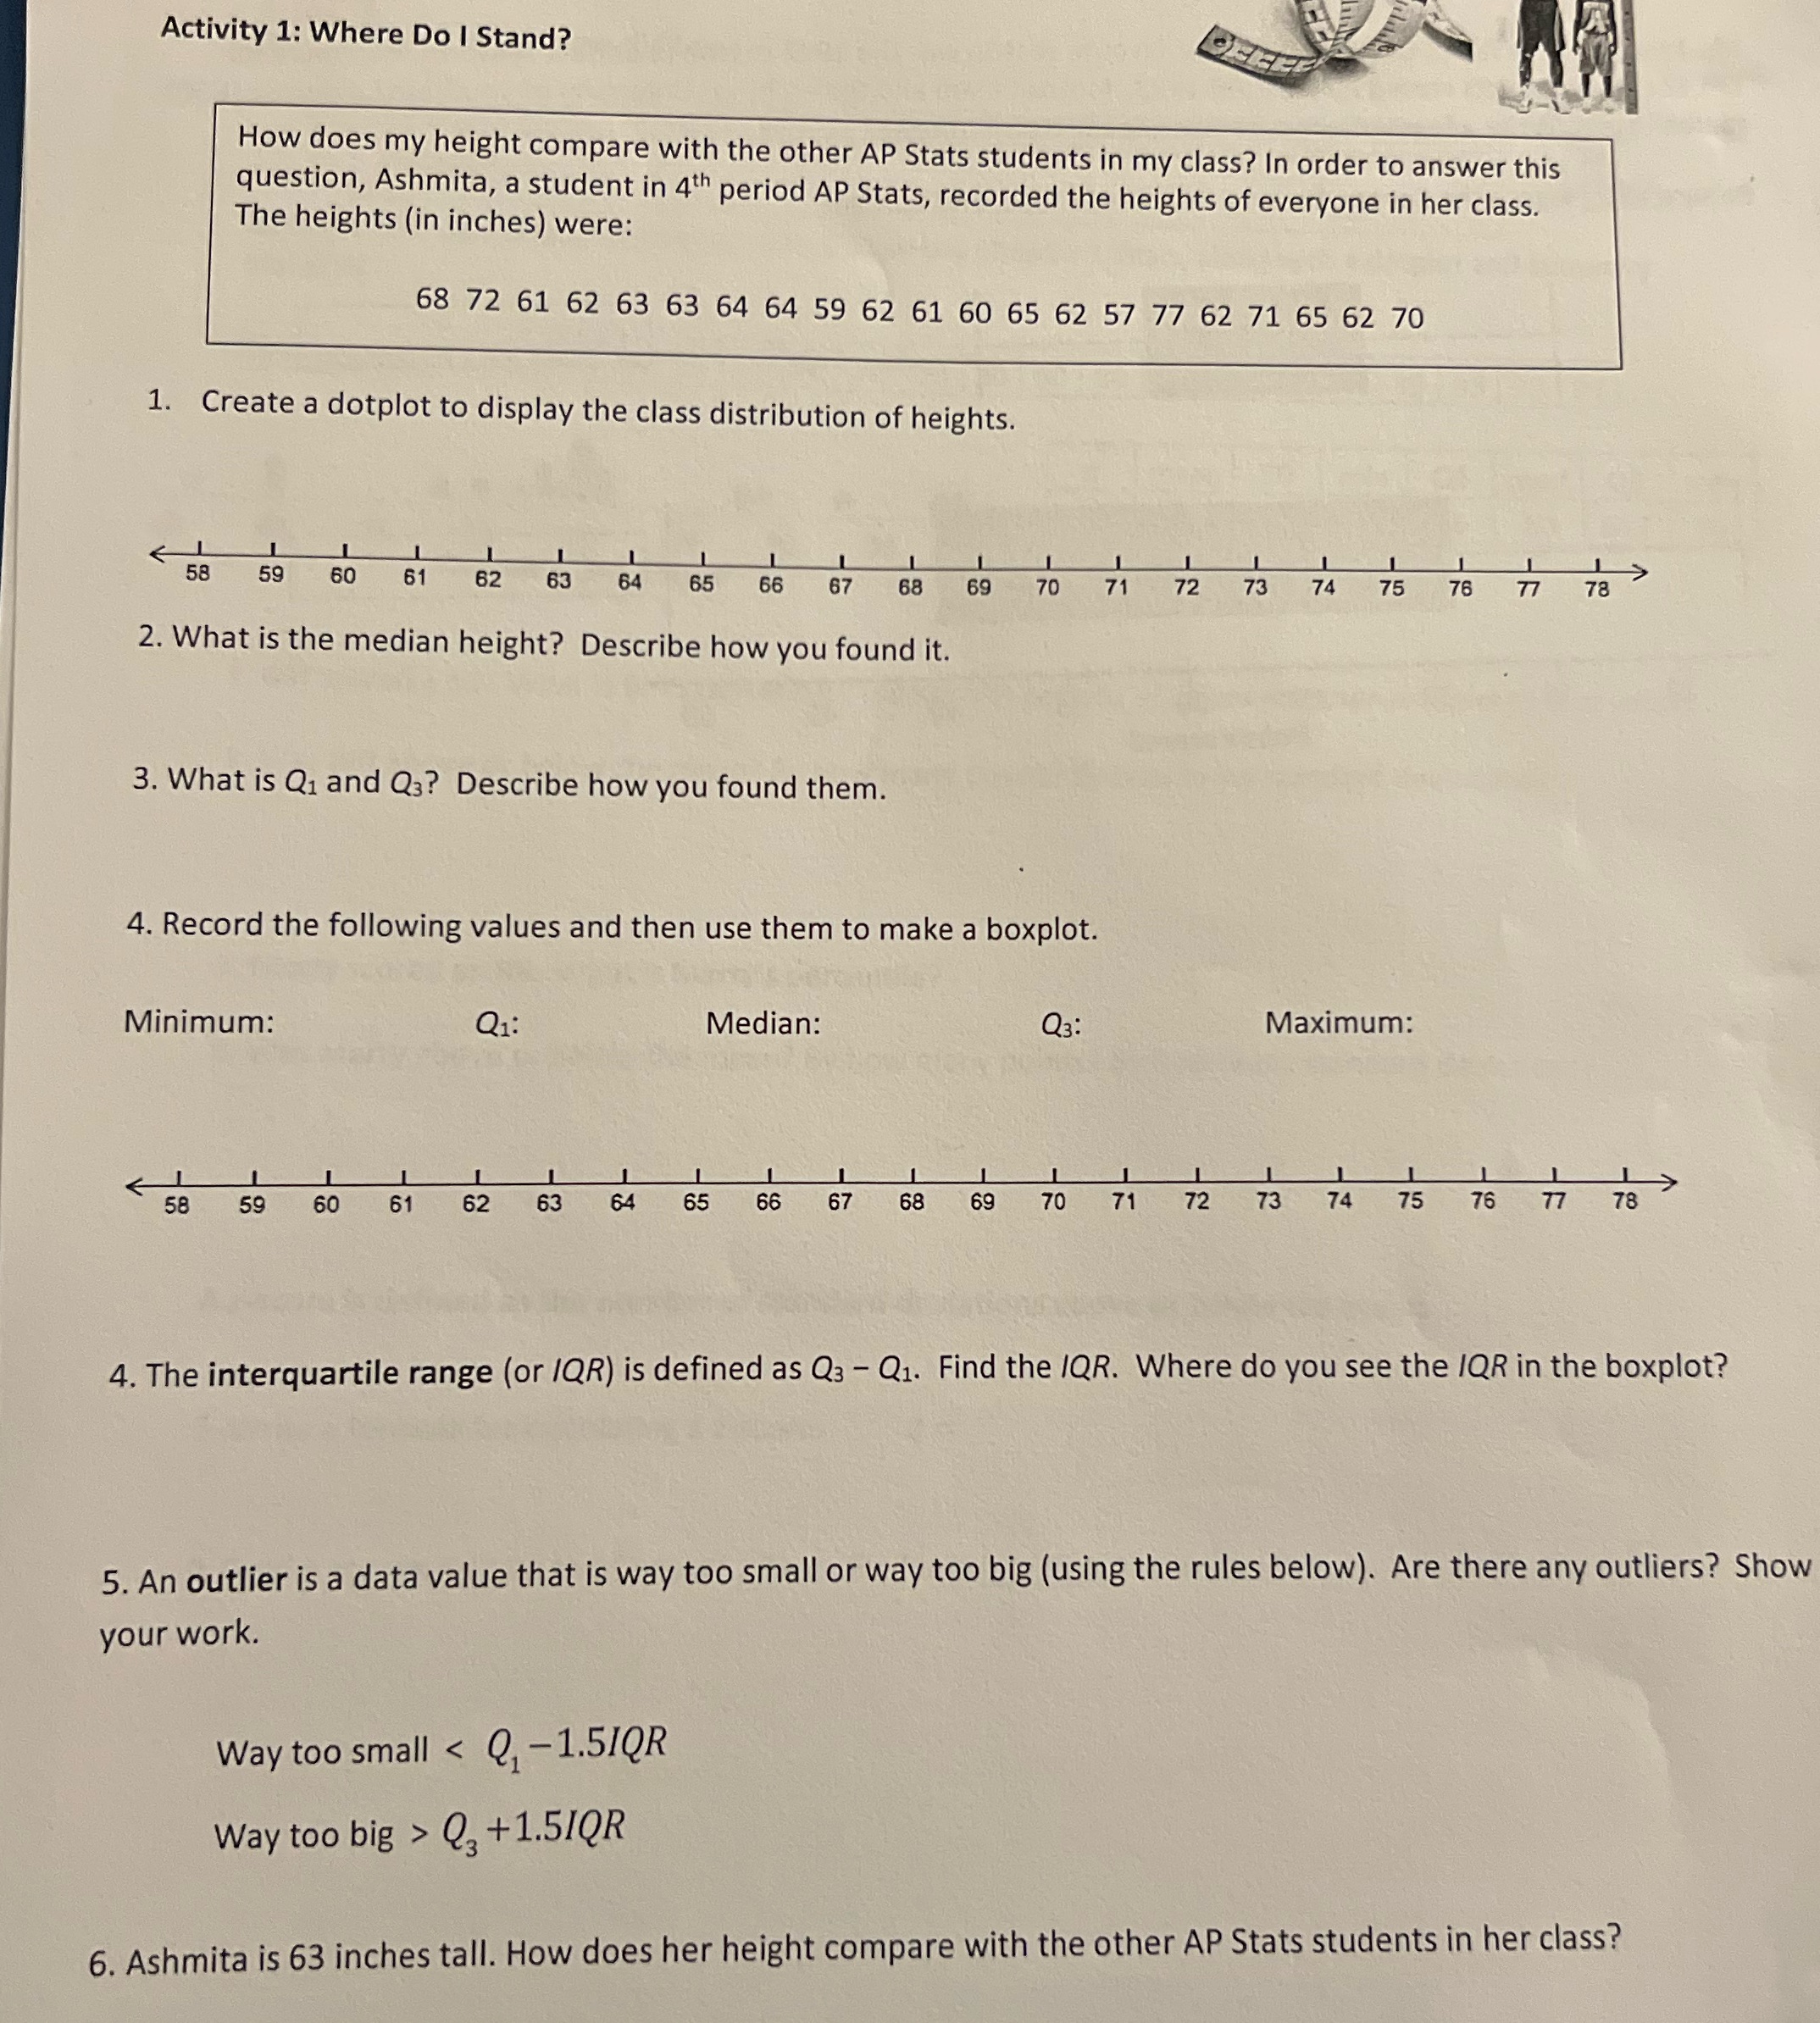
Activity 1: Where Do I Stand? ORIEEE How does my height compare with the other AP Stats students in my class? In order to answer this question, Ashmita, a student in 4th period AP Stats, recorded the heights of everyone in her class. The heights (in inches) were: 68 72 61 62 63 63 64 64 59 62 61 60 65 62 57 77 62 71 65 62 70 1. Create a dotplot to display the class distribution of heights. 58 59 60 62 65 66 67 68 69 70 71 72 73 74 75 76 77 78 2. What is the median height? Describe how you found it. 3. What is Q1 and Q3? Describe how you found them. 4. Record the following values and then use them to make a boxplot. Minimum: Q1: Median: Q3: Maximum: 58 59 60 61 62 63 64 65 66 67 68 69 70 71 72 73 74 75 76 77 78 4. The interquartile range (or /QR) is defined as Q3 - Q1. Find the IQR. Where do you see the IQR in the boxplot? 5. An outlier is a data value that is way too small or way too big (using the rules below). Are there any outliers? Show your work. Way too small Q, +1.51QR 6. Ashmita is 63 inches tall. How does her height compare with the other AP Stats students in her class
Step by Step Solution
There are 3 Steps involved in it

Get step-by-step solutions from verified subject matter experts