

Question: 15. Consider the diagram below with two curves. Which do you suspect to be the T curve? Answer A Answer B 16. Which is true
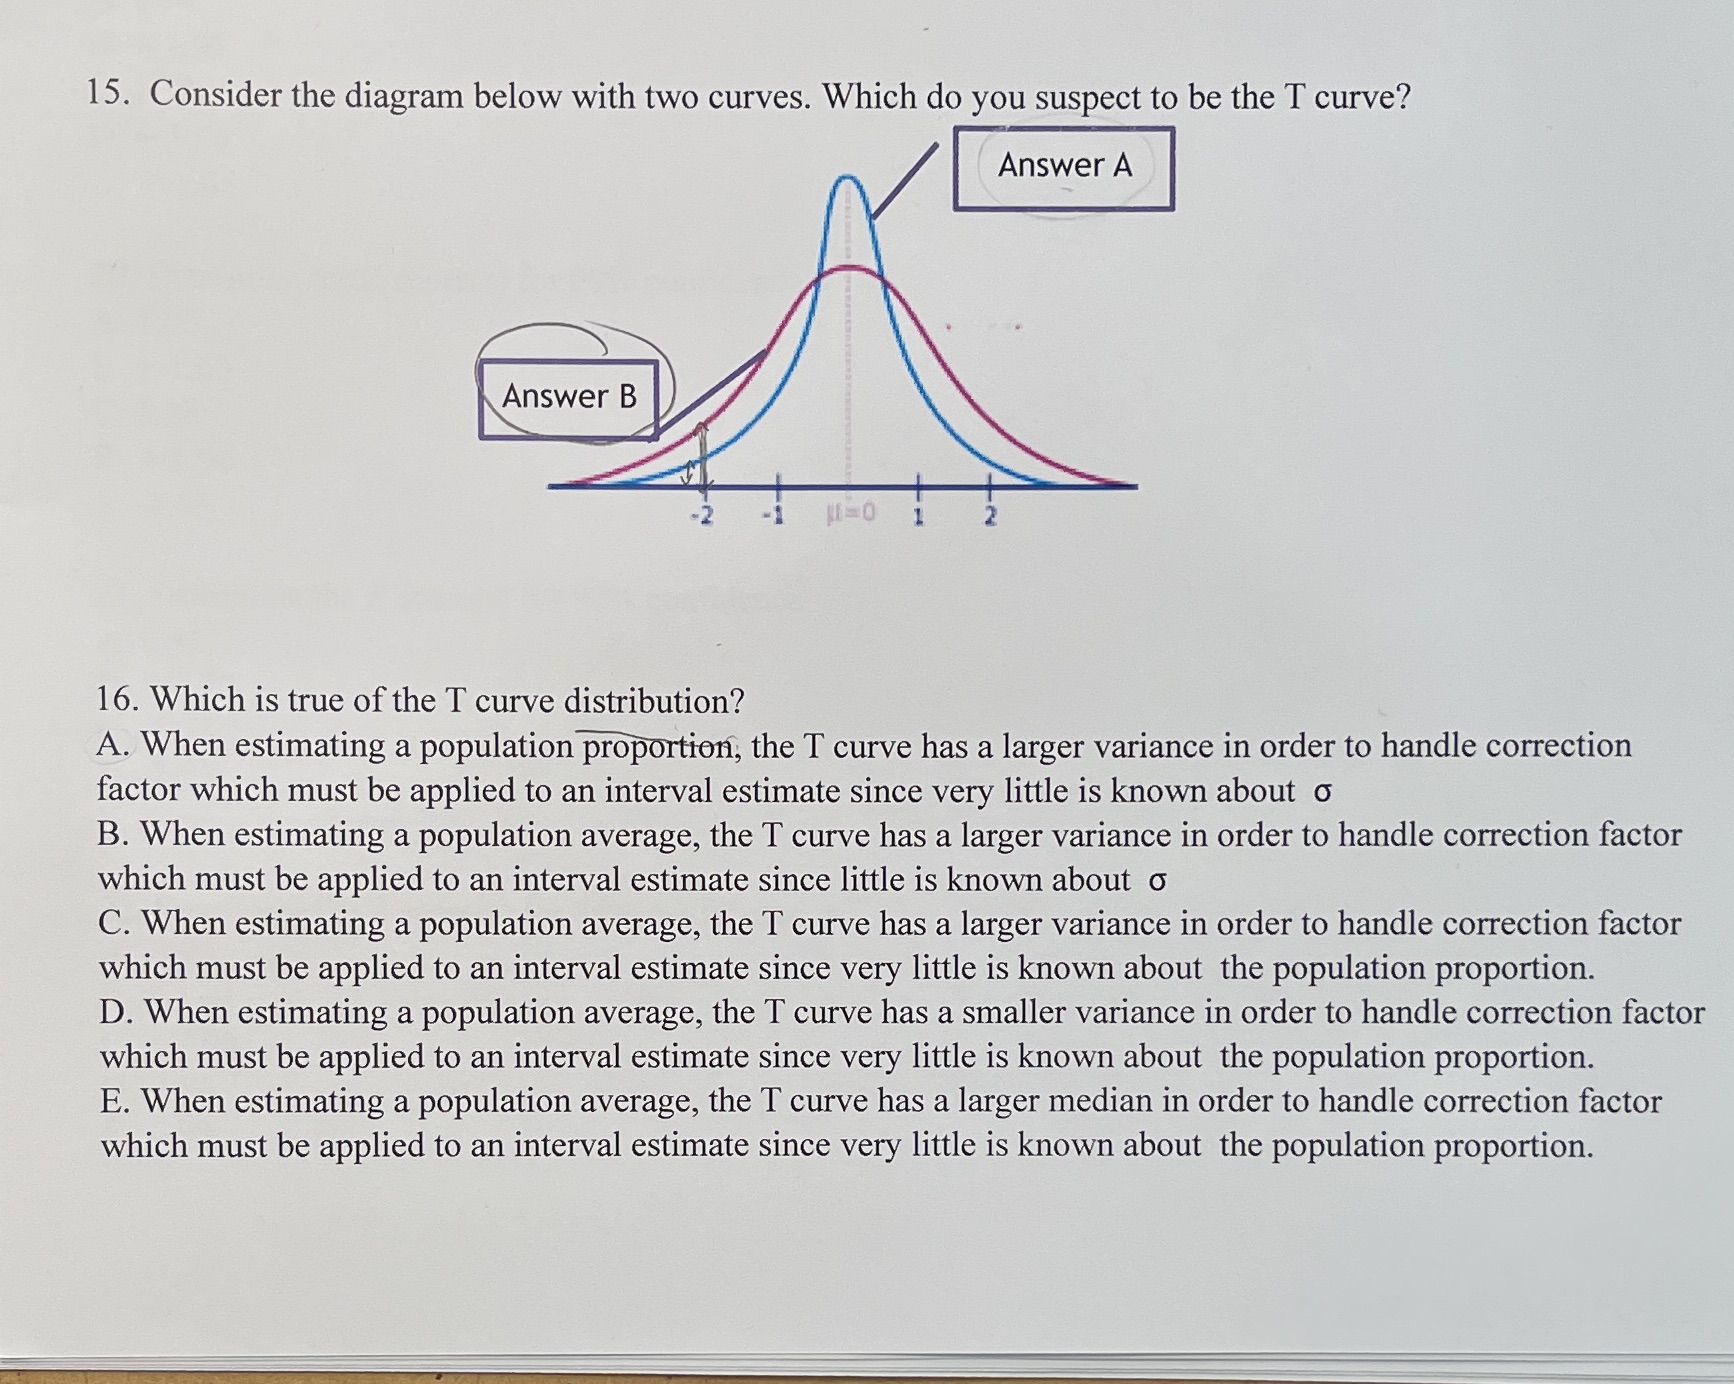
15. Consider the diagram below with two curves. Which do you suspect to be the T curve? Answer A Answer B 16. Which is true of the T curve distribution? A. When estimating a population proportion, the T curve has a larger variance in order to handle correction factor which must be applied to an interval estimate since very little is known about o B. When estimating a population average, the T curve has a larger variance in order to handle correction factor which must be applied to an interval estimate since little is known about o C. When estimating a population average, the T curve has a larger variance in order to handle correction factor which must be applied to an interval estimate since very little is known about the population proportion. D. When estimating a population average, the T curve has a smaller variance in order to handle correction factor which must be applied to an interval estimate since very little is known about the population proportion. E. When estimating a population average, the T curve has a larger median in order to handle correction factor which must be applied to an interval estimate since very little is known about the population proportion
Step by Step Solution
There are 3 Steps involved in it

Get step-by-step solutions from verified subject matter experts