

Question: 15.2 Excel Activity 1a - Linear Regression and Predictions (Structured) See attached for data The National Football League (NFL) records a variety of performance data
15.2 Excel Activity 1a - Linear Regression and Predictions (Structured)
See attached for data
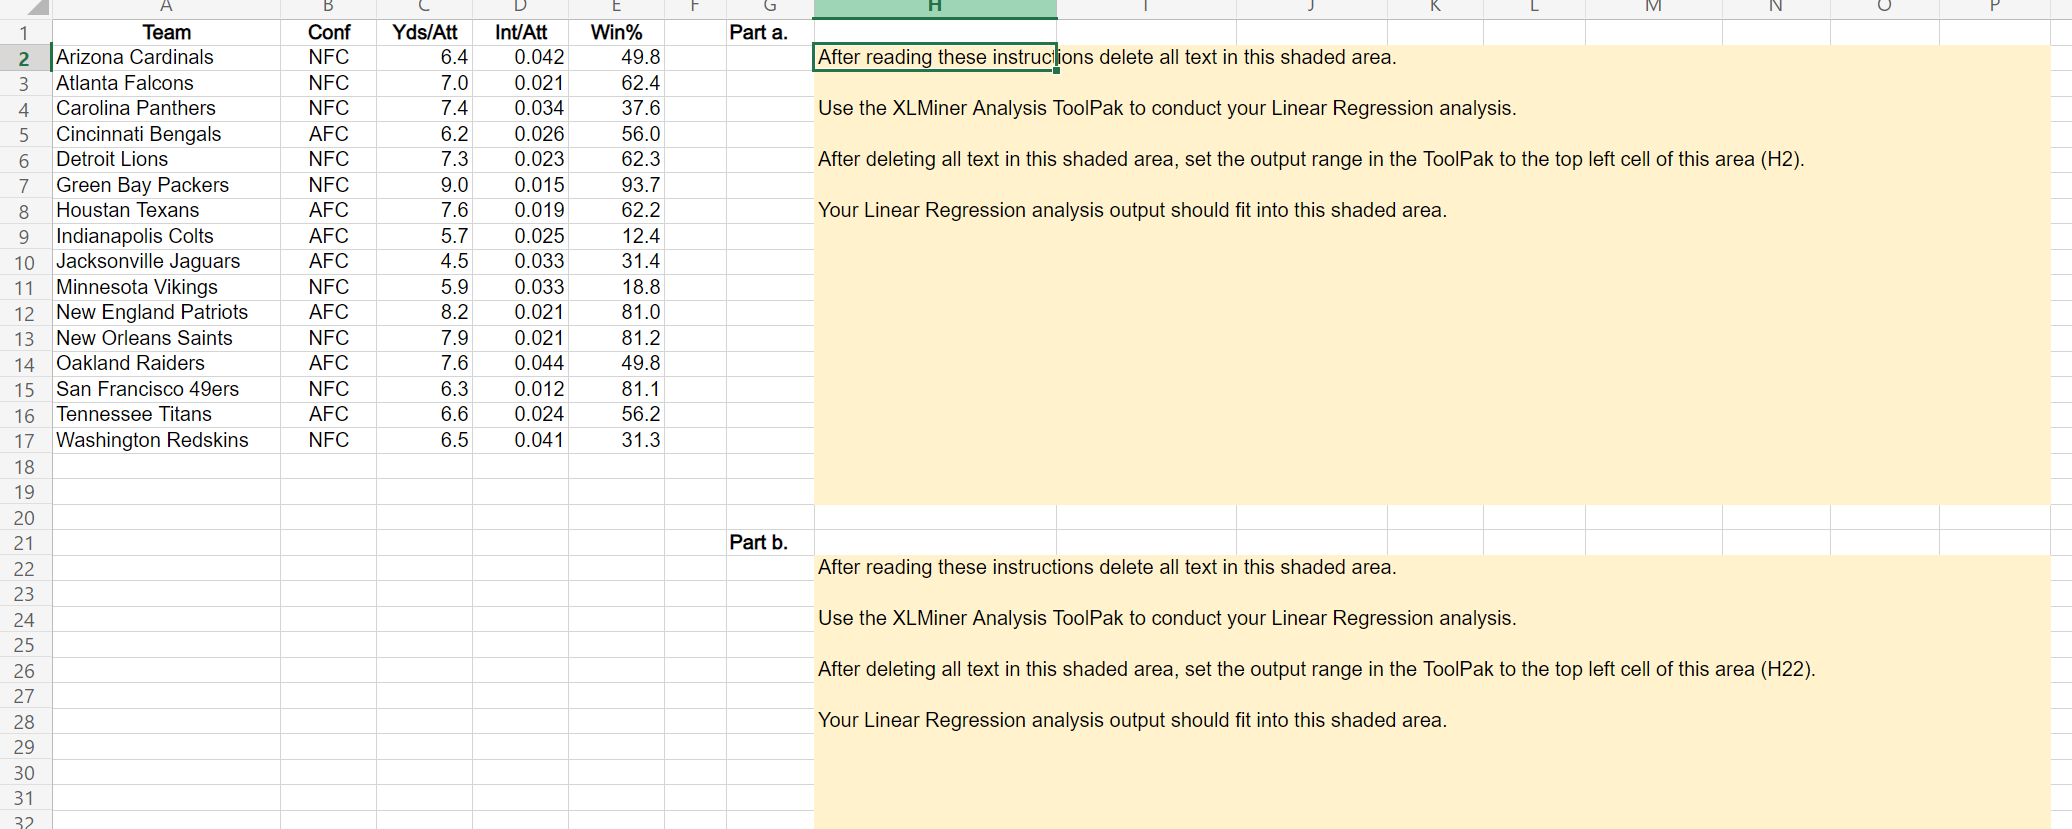
The National Football League (NFL) records a variety of performance data for individuals and teams. To investigate the importance of passing on the percentage of games won by a team, the data in the Excel Online file below show the conference (Conf), average number of passing yards per attempt (Yds/Att), the number of interceptions thrown per attempt (Int/Att), and the percentage of games won (Win%) for a random sample of 16 NFL teams for a season. Construct a spreadsheet to answer the following questions.
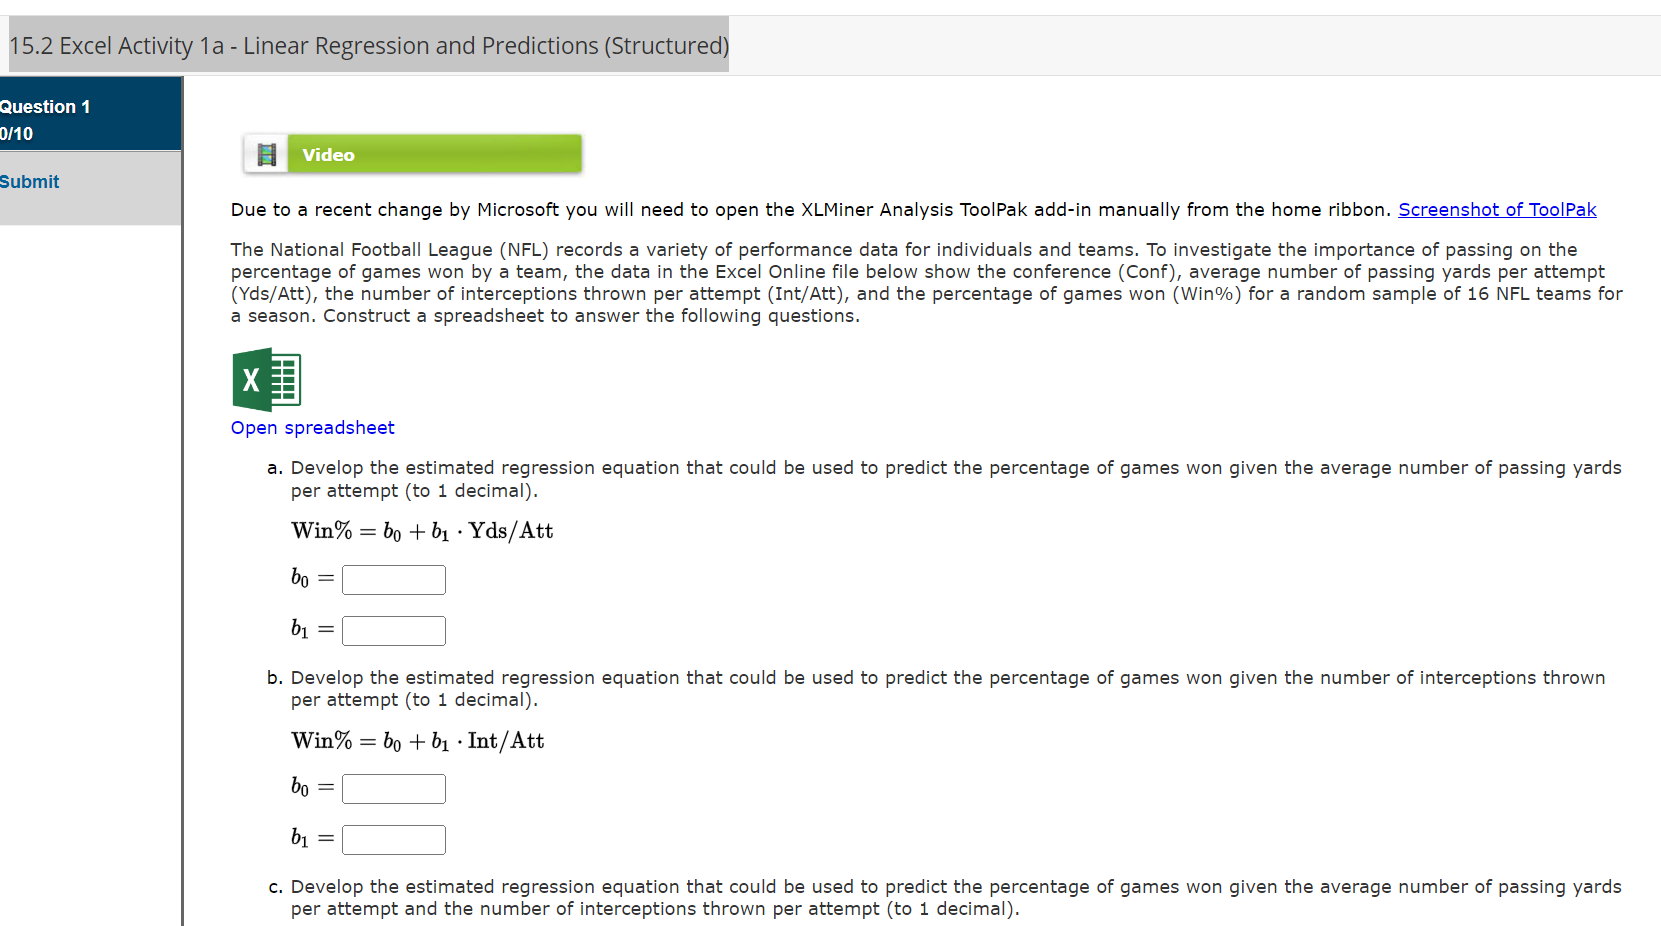
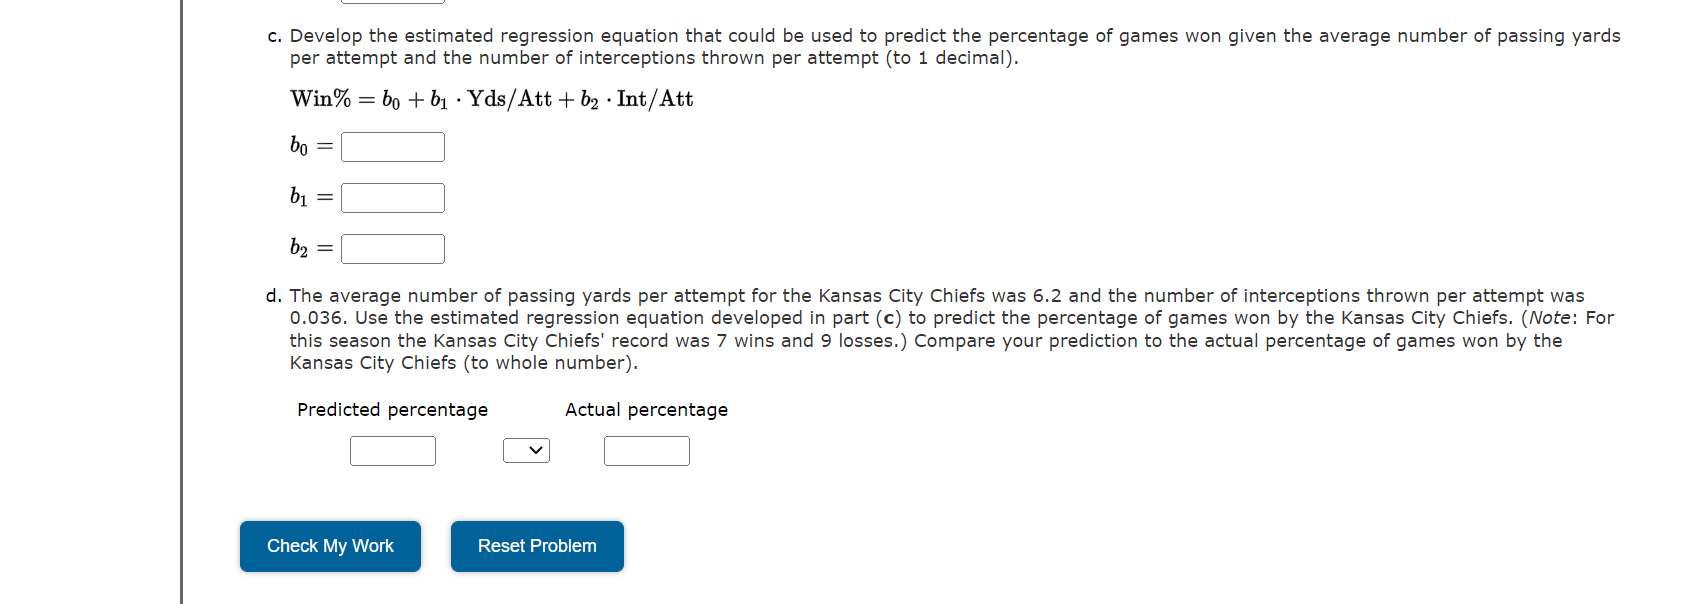

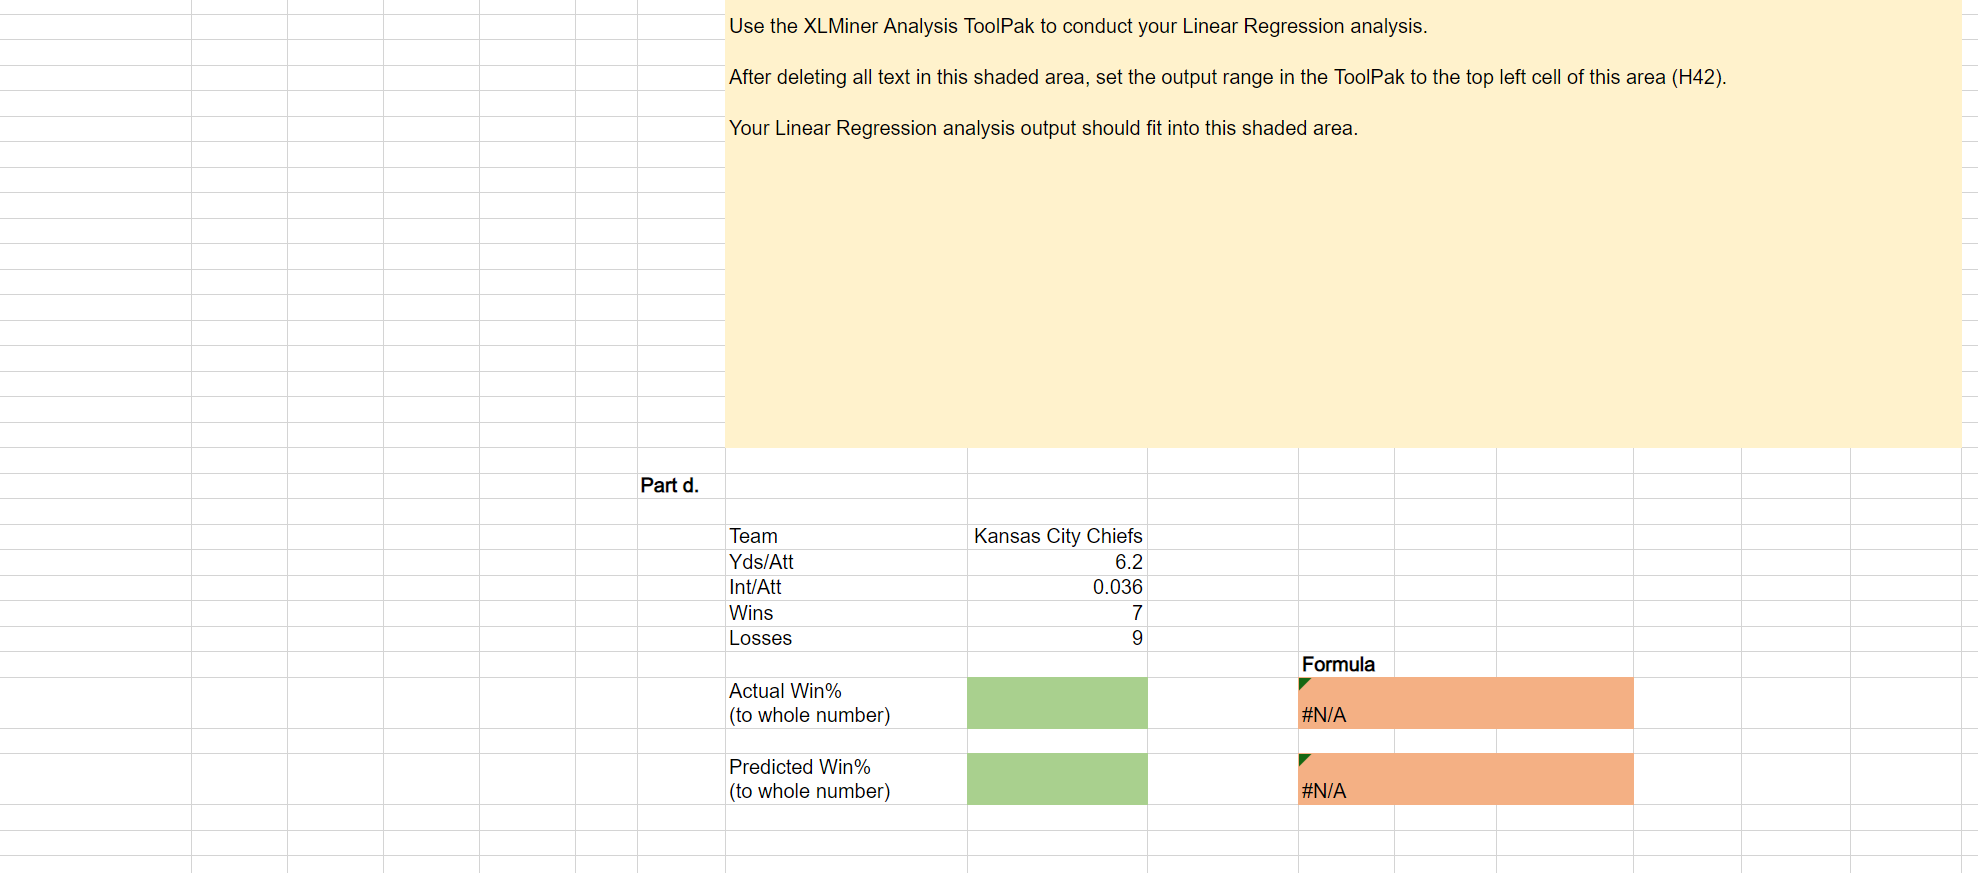
Due to a recent change by Microsolt you will need to open the XLMiner Analysis ToolPak add-in manually from the home ribbon. Screenshot of ToolPak Submit The National Football League (NFL) records a variety of performance data for individuals and teams. To investigate the importance of passing on the percentage of games won by a team, the data in the Excel Online file below show the conference (Conf), average number of passing yards per attempt (Yds/Att), the number of interceptions thrown per attempt (Int/Att), and the percentage of games won (Win%) for a random sample of 16 NFL teams for a season. Construct a spreadsheet to answer the following questions. Open spreadsheet a. Develop the estimated regression equation that could be used to predict the percentage of games won given the average number of passing yards per attempt (to 1 decimal). Win% = be + b1 -Yds/Att be = C] In C] b. Develop the estimated regression equation that could be used to predict the percentage of games won given the number of interceptions thrown per attempt (to 1 decimal). wm% = be + b1 -Int/Att 50 =:] 51 :l c. Develop the estimated regression equation that could be used to predict the percentage of games won given the average number of passing yards per attempt and the number of interceptions thrown per attempt (to 1 decimal). c. Develop the estimated regression equation that could be used to predict the percentage of games won given the average number of passing yards per attempt and the number of interceptions thrown per attempt (to 1 decimal). Win% = b0 +b1-Yds/Att-l-bz-Int/Att bo=l:l IFS 122:: d. The average number of passing yards per attempt for the Kansas City Chiefs was 6.2 and the number of interceptions thrown per attempt was 0.036. Use the estimated regression equation developed in part (c) to predict the percentage of games won by the Kansas City Chiefs. (Note: For this season the Kansas City Chiefs' record was 7 wins and 9 losses.) Compare your prediction to the actual percentage of games won by the Kansas City Chiefs (to whole number). Predicted percentage Actual percentage :l-Cl Check My Work Reset Problem \fUse the XLMiner Analysis ToolPak to conduct your Linear Regression analysis. Aer deleting all text in this shaded area, set the output range in the TualPak to the top left cell of this area (H42). Your Linear Regression analysis output should t into this shaded area. Part :1. Team Kansas City Chiefs Yds/Att 6.2 Int/Att 0.036 Wins 7 Losses 9 Formula Actual Win% (to whole number) Predicted Win% (to whole number)
Step by Step Solution
There are 3 Steps involved in it

Get step-by-step solutions from verified subject matter experts