

Question: 15.2 Excel Activity 1b - Linear Regression and Predictions (Freeform) 15.2 Excel Activity 1b - Linear Regression and Predictions (Freeform) See attached for data The
15.2 Excel Activity 1b - Linear Regression and Predictions (Freeform)
15.2 Excel Activity 1b - Linear Regression and Predictions (Freeform)
See attached for data
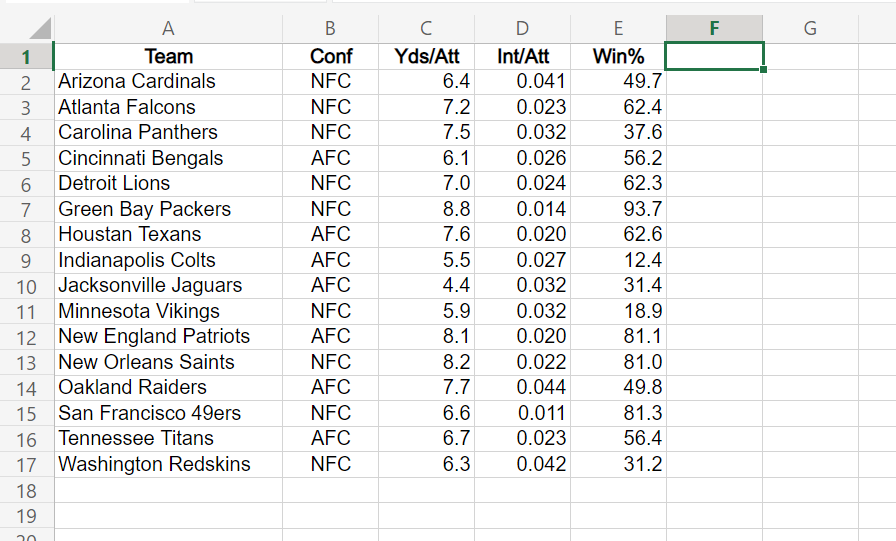
The National Football League (NFL) records a variety of performance data for individuals and teams. To investigate the importance of passing on the percentage of games won by a team, the data in the Excel Online file below show the conference (Conf), average number of passing yards per attempt (Yds/Att), the number of interceptions thrown per attempt (Int/Att), and the percentage of games won (Win%) for a random sample of 16 NFL teams for a season. Construct a spreadsheet to answer the following questions.


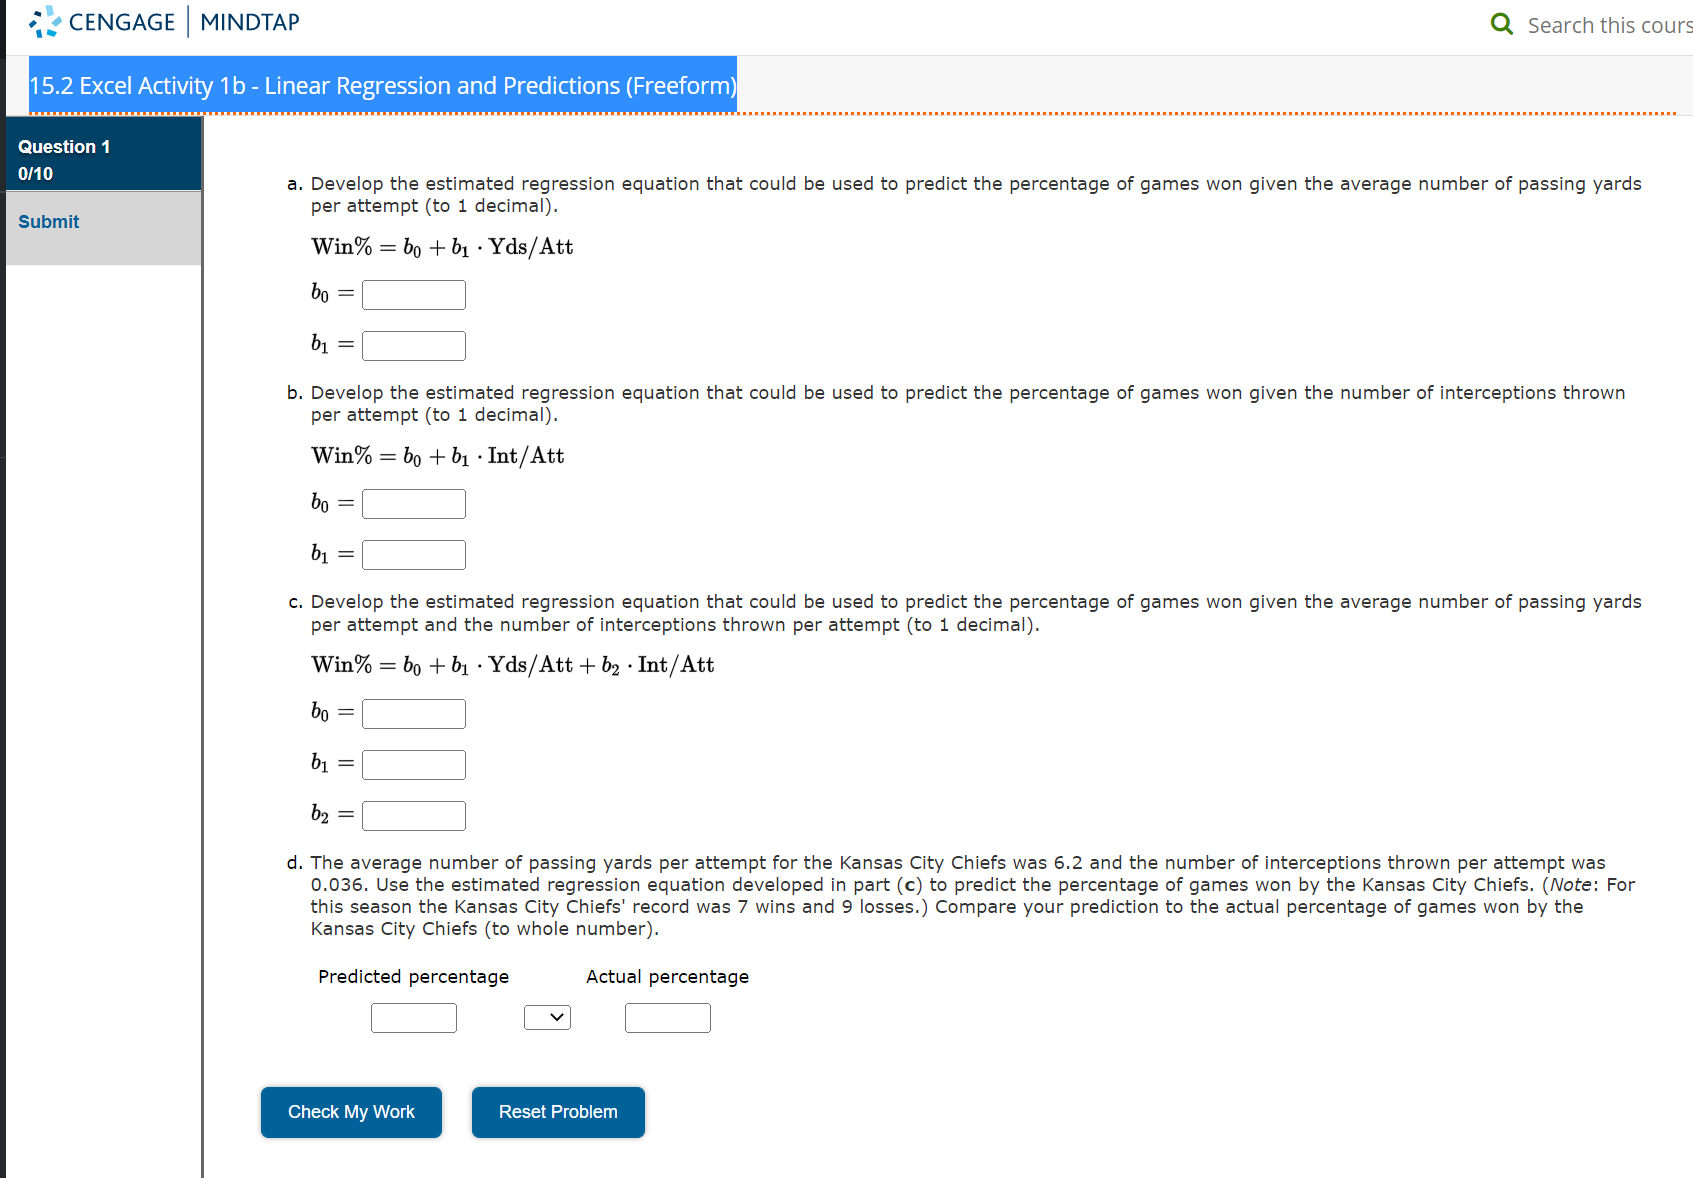
7" CENGAGE I MINDTAP Q Search this tours 15.2 Excel Activity 1 b - Linear Regression and Predictions (Freeform) Question 1 011 D a. Develop the estimated regression equation that could be used to predict the percentage of games won given the average number of passing yards per attempt (to 1 decimal). Will% = b0 + b1 ' YdS/Att b0 = :l b1 :l b. Develop the estimated regression equation that could be used to predict the percentage of games won given the number of interceptions thrown per attempt (to 1 decimal). Wi.n% = b0 + 121 -Int/Att be = :1 b1 :1 c. Develop the estimated regression equation that could be used to predict the percentage of games won given the average number of passing yards per attempt and the number of interceptions thrown per attempt (to 1 decimal). Wi.n% = be + 121 'Yds/Att + b2 'Int/Att boal:l b1=:] b2=:l d. The average number of passing yards per attempt for the Kansas City Chiefs was 6.2 and the number of interceptions thrown per attempt was 0.036. Use the estimated regression equation developed in part (c) to predict the percentage of games won by the Kansas City Chiefs. (Note: For this season the Kansas City Chiefs' record was 7 wins and 9 losses.) Compare your prediction to the actual percentage of games won by the Kansas City Chiefs (to whole number). Submit Predicted percentage Actual percentage :l-Cl Check My Work Reset Problem A B C D E F G Team Conf Yds/Att Int/Att Win% NFC 6.4 0.041 49.7 IN Arizona Cardinals 3 Atlanta Falcons NFC 7.2 0.023 62.4 4 Carolina Panthers NFC 7.5 0.032 37.6 5 Cincinnati Bengals AFC 6.1 0.026 56.2 6 Detroit Lions NFC 7.0 0.024 62.3 7 Green Bay Packers NFC 8.8 0.014 93.7 8 Houstan Texans AFC 7.6 0.020 62.6 9 Indianapolis Colts AFC 5.5 0.027 12.4 10 Jacksonville Jaguars AFC 4.4 0.032 31.4 11 Minnesota Vikings NFC 5.9 0.032 18.9 12 New England Patriots AFC 8.1 0.020 81.1 13 New Orleans Saints NFC 8.2 0.022 81.0 14 Oakland Raiders AFC 7.7 0.044 49.8 15 San Francisco 49ers NFC 6.6 0.011 81.3 16 Tennessee Titans AFC 6.7 0.023 56.4 17 Washington Redskins NFC 6.3 0.042 31.2 18 19
Step by Step Solution
There are 3 Steps involved in it

Get step-by-step solutions from verified subject matter experts