

Question: 16. [-/2.64 Points] DETAILS DEVORESTAT9 9.1.007. MY NOTES ASK YOUR TEACHER PRACTICE ANOTHER Is there any systematic tendency for part-time college faculty to hold their
![16. [-/2.64 Points] DETAILS DEVORESTAT9 9.1.007. MY NOTES ASK YOUR TEACHER](https://s3.amazonaws.com/si.experts.images/answers/2024/06/667e122ee5c9b_222667e122ebfbac.jpg)
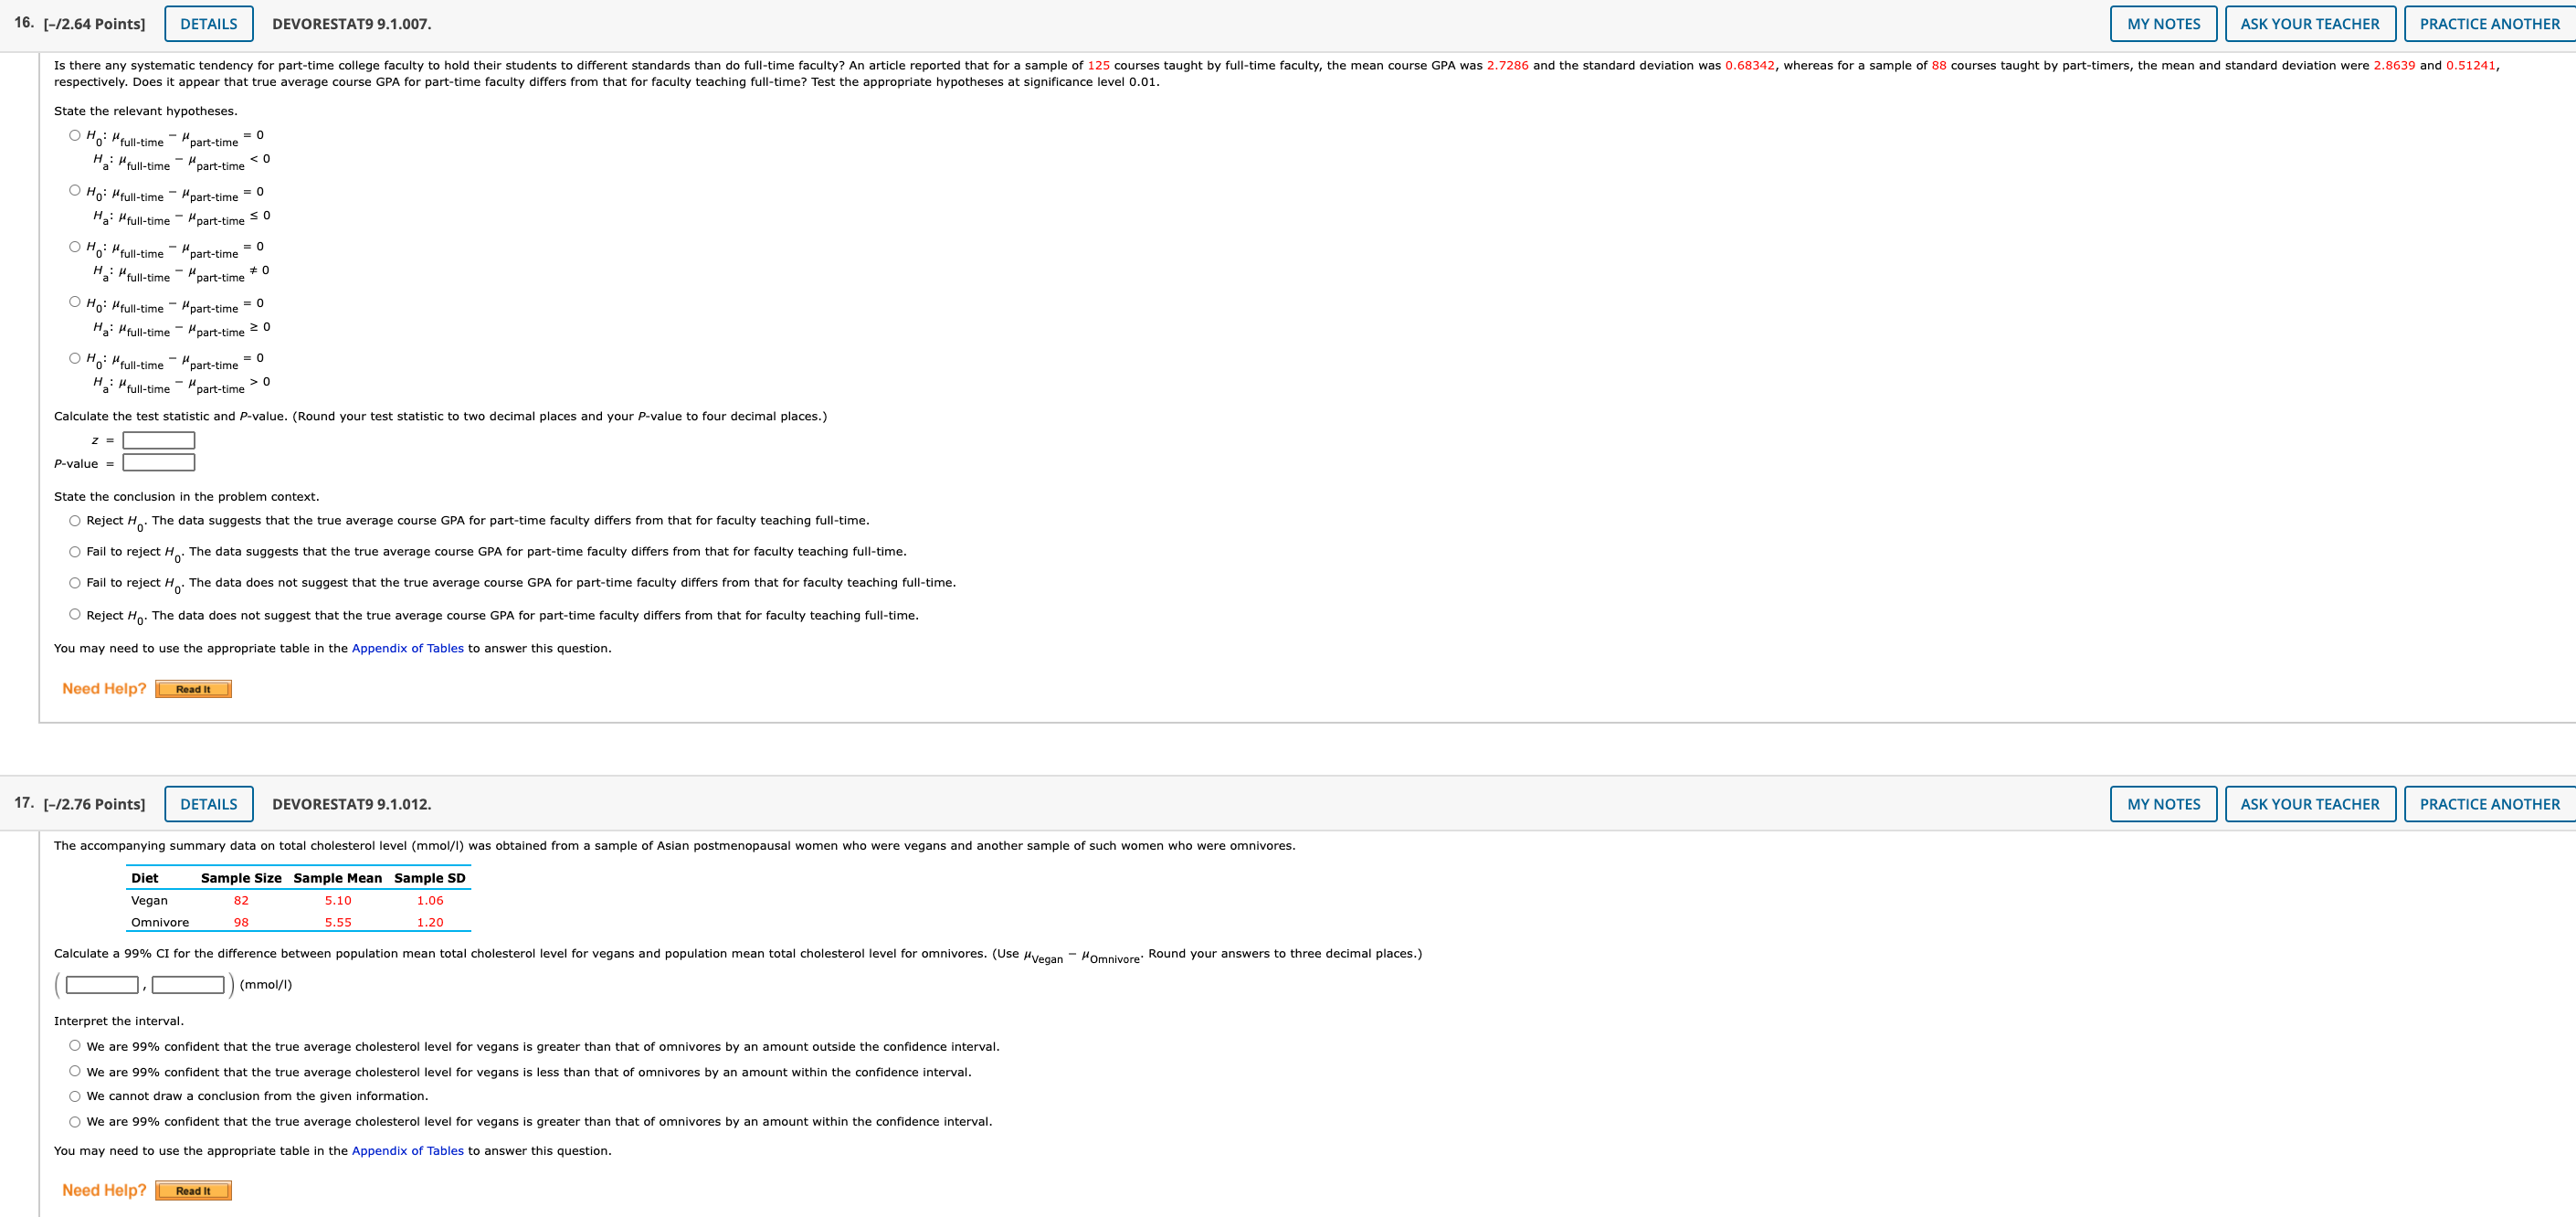
16. [-/2.64 Points] DETAILS DEVORESTAT9 9.1.007. MY NOTES ASK YOUR TEACHER PRACTICE ANOTHER Is there any systematic tendency for part-time college faculty to hold their students to different standards than do full-time faculty? An article reported that for a sample of 125 courses taught by full-time faculty, the mean course GPA was 2.7286 and the standard deviation was 0.68342, whereas for a sample of 88 courses taught by part-timers, the mean and standard deviation were 2.8639 and 0.51241, respectively. Does it appear that true average course GPA for part-time faculty differs from that for faculty teaching full-time? Test the appropriate hypotheses at significance level 0.01. State the relevant hypotheses. O Ho: "full-time part-time = 0 Ha: " full-time - "part-time
Step by Step Solution
There are 3 Steps involved in it

Get step-by-step solutions from verified subject matter experts