

Question: 16. Below is a normal plot of 15 fitted sums of effects from a 25-2 fractional factorial experiment whose generators were E ABC and F
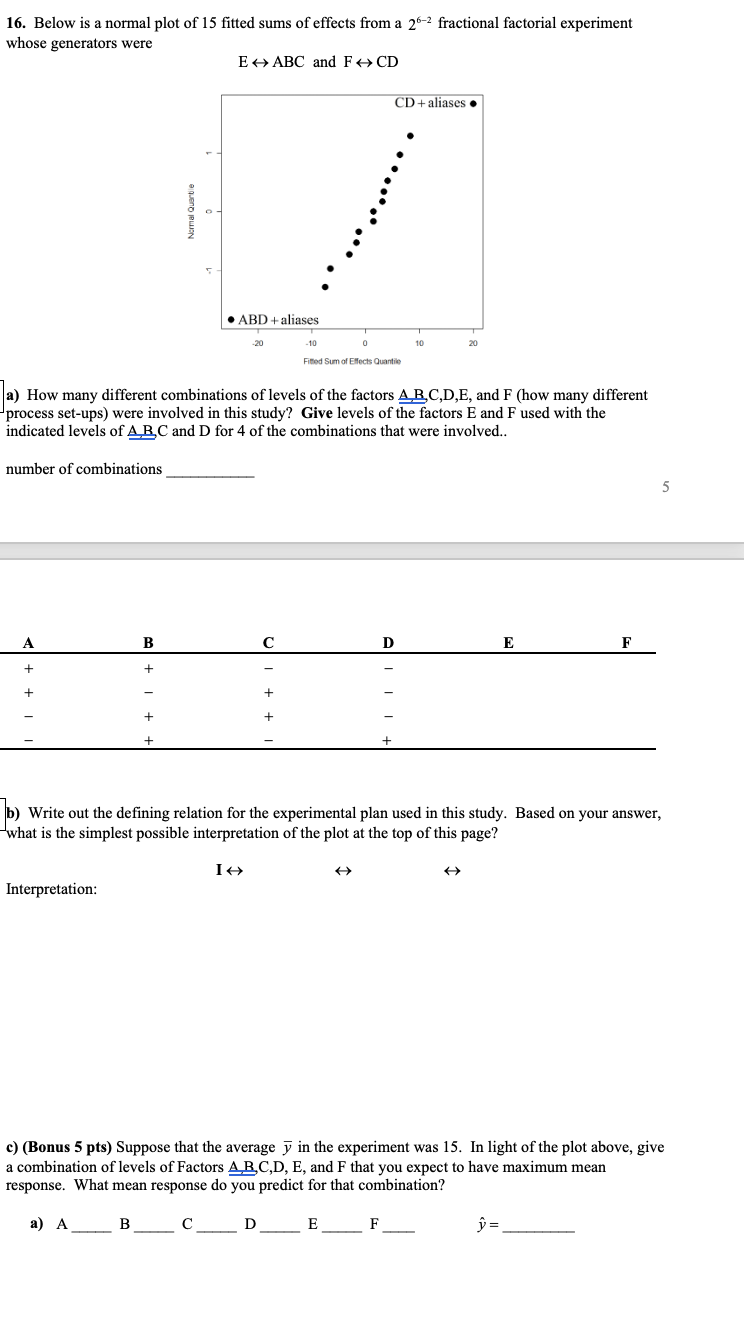

16. Below is a normal plot of 15 fitted sums of effects from a 25-2 fractional factorial experiment whose generators were E ABC and F CD CD + aliases . . . . . . . . Normal Quartile . ABD + aliases -20 -10 Fitted Sum of Effects Quantile a) How many different combinations of levels of the factors A B.C,D,E, and F (how many different process set-ups) were involved in this study? Give levels of the factors E and F used with the indicated levels of A B. C and D for 4 of the combinations that were involved.. number of combinations 5 A C D E F + + + 1 II I + + + + + b) Write out the defining relation for the experimental plan used in this study. Based on your answer, "what is the simplest possible interpretation of the plot at the top of this page? Interpretation: c) (Bonus 5 pts) Suppose that the average y in the experiment was 15. In light of the plot above, give a combination of levels of Factors A B.C,D, E, and F that you expect to have maximum mean response. What mean response do you predict for that combination? a) A B C D E F y =
Step by Step Solution
There are 3 Steps involved in it

Get step-by-step solutions from verified subject matter experts