

Question: (1-6) Calculate upper control limit (UCL) and lower control limit (LCL) of R chart by approximation using R (1-7) Create R chart with center line,
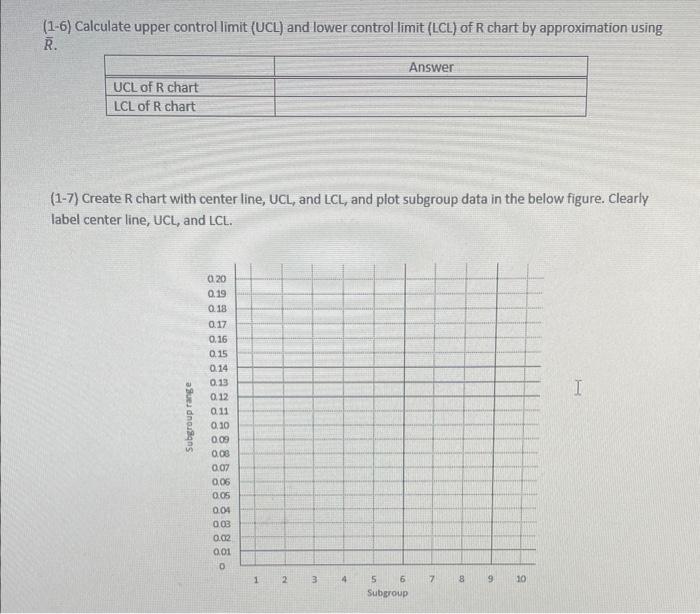
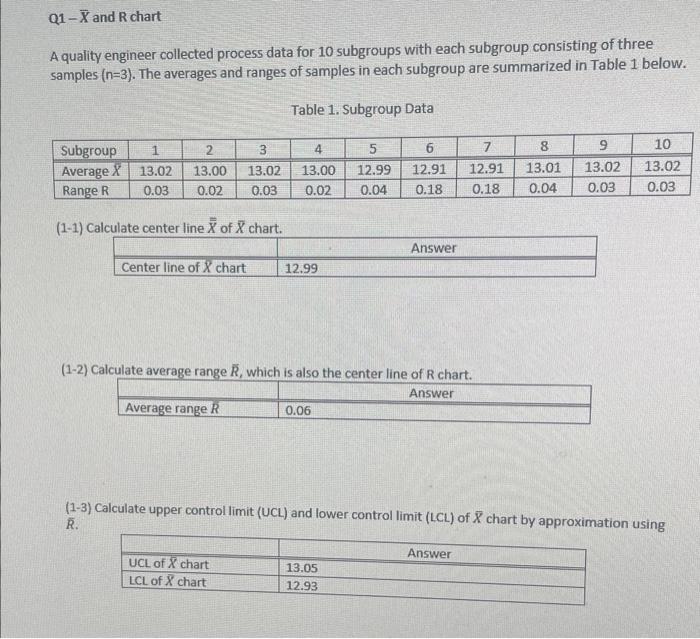
(1-6) Calculate upper control limit (UCL) and lower control limit (LCL) of R chart by approximation using R (1-7) Create R chart with center line, UCL, and LCL, and plot subgroup data in the below figure. Clearly label center line, UCL, and LCL. A quality engineer collected process data for 10 subgroups with each subgroup consisting of three samples (n=3). The averages and ranges of samples in each subgroup are summarized in Table 1 below. Table 1. Subgroup Data (1-2) Calculate average range R, which is also the center line of R chart. (1-3) Calculate upper control limit (UCL) and lower control limit (LCL) of X chart by approximation using
Step by Step Solution
There are 3 Steps involved in it
1 Expert Approved Answer
Step: 1 Unlock

Question Has Been Solved by an Expert!
Get step-by-step solutions from verified subject matter experts
Step: 2 Unlock
Step: 3 Unlock