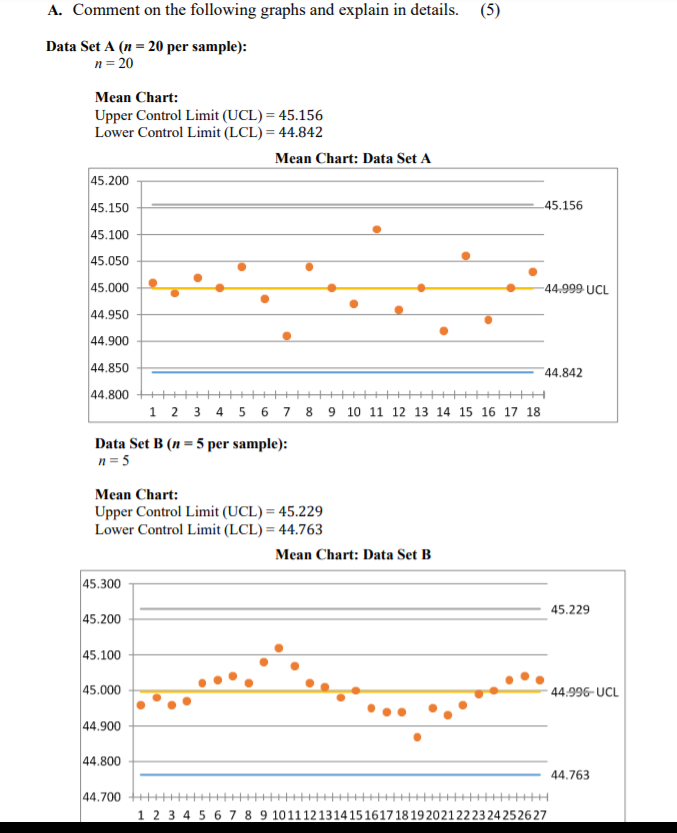
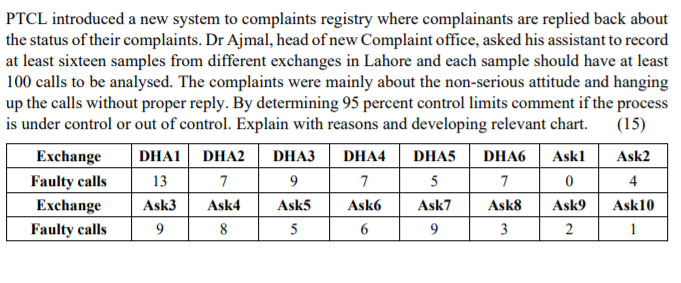
Question: This is one complete question. Someone please answer this question as soon as possible. Please. A. Comment on the following graphs and explain in details.

This is one complete question. Someone please

This is one complete question. Someone please This is one complete question. Someone please answer this question as soon as possible. Please.

A. Comment on the following graphs and explain in details. (5) Data Set A (n = 20 per sample): n=20 Mean Chart: Upper Control Limit (UCL) = 45.156 Lower Control Limit (LCL) = 44.842 Mean Chart: Data Set A 45.200 45.150 45.100 45.156 45.050 45.000 -44.999 UCL 44.950 44.900 44.850 44.842 44.800 1 2 3 4 5 6 7 8 9 10 11 12 13 14 15 16 17 18 Data Set B (n = 5 per sample): n= 5 Mean Chart: Upper Control Limit (UCL) = 45.229 Lower Control Limit (LCL) = 44.763 Mean Chart: Data Set B 45.300 45.229 45.200 45.100 45.000 44.996-UCL 44.900 44.800 44.763 44.700 1 2 3 4 5 6 7 8 9 101112131415161718192021222324252627 PTCL introduced a new system to complaints registry where complainants are replied back about the status of their complaints. Dr Ajmal, head of new Complaint office, asked his assistant to record at least sixteen samples from different exchanges in Lahore and each sample should have at least 100 calls to be analysed. The complaints were mainly about the non-serious attitude and hanging up the calls without proper reply. By determining 95 percent control limits comment if the process is under control or out of control. Explain with reasons and developing relevant chart. (15) Exchange DHAI DHA2 DHA3 DHA4 DHA5 DHAO Ask1 Ask2 Faulty calls 13 7. 9 7 5 7 0 4 Exchange Ask3 Ask4 Ask5 Ask6 Ask7 Ask8 Ask9 Ask10 Faulty calls 9 8 5 6 9 3 2 1

Step by Step Solution

There are 3 Steps involved in it

1 Expert Approved Answer
Step: 1 Unlock blur-text-image
Question Has Been Solved by an Expert!

Get step-by-step solutions from verified subject matter experts

Step: 2 Unlock
Step: 3 Unlock

Students Have Also Explored These Related General Management Questions!