

Question: - (1.6) Plot the MTF on a single graph for each of the convolution filters shown below. 1 1 1 1 1 1 4 1
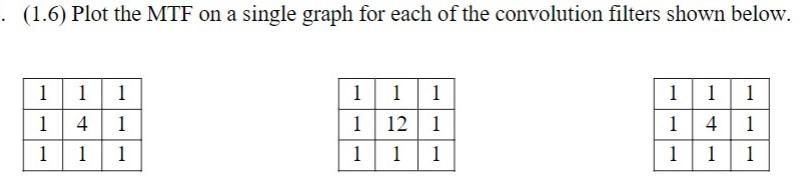
- (1.6) Plot the MTF on a single graph for each of the convolution filters shown below. 1 1 1 1 1 1 4 1 1 11 4 1 1 1 1 121 11 1 1 1 1 1 4 1 1 1 1 1 - (1.6) Plot the MTF on a single graph for each of the convolution filters shown below. 1 1 1 1 1 1 4 1 1 11 4 1 1 1 1 121 11 1 1 1 1 1 4 1 1 1 1 1
Step by Step Solution
There are 3 Steps involved in it
1 Expert Approved Answer
Step: 1 Unlock

Question Has Been Solved by an Expert!
Get step-by-step solutions from verified subject matter experts
Step: 2 Unlock
Step: 3 Unlock