

Question: 16. Refer to the graph above to answer this question. What does this graph indicate? A. That government spending is autonomous of real GDP and
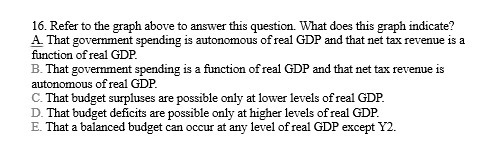
16. Refer to the graph above to answer this question. What does this graph indicate? A. That government spending is autonomous of real GDP and that net tax revenue is a function of real GDP. B. That government spending is a function of real GDP and that net tax revenue is autonomous of real GDP. C. That budget surpluses are possible only at lower levels of real GDP. D. That budget deficits are possible only at higher levels of real GDP. E. That a balanced budget can occur at any level of real GDP except Y2
Step by Step Solution
There are 3 Steps involved in it
1 Expert Approved Answer
Step: 1 Unlock

Question Has Been Solved by an Expert!
Get step-by-step solutions from verified subject matter experts
Step: 2 Unlock
Step: 3 Unlock