

Question: 1.64 Hispanic population. The US census collects data on race and ethnicity of Americans, among many other variables. The histogram below shows the distribution of
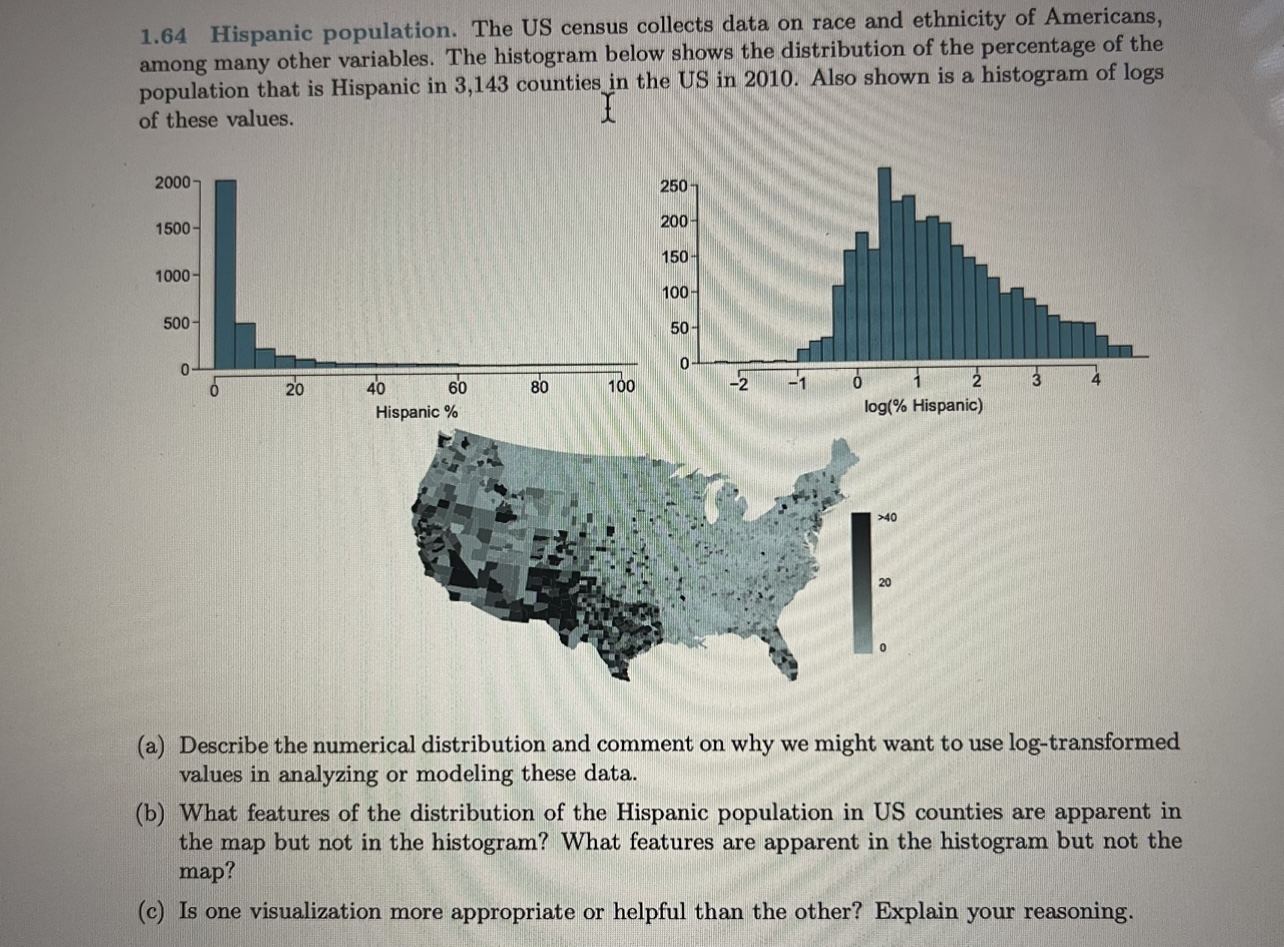

1.64 Hispanic population. The US census collects data on race and ethnicity of Americans, among many other variables. The histogram below shows the distribution of the percentage of the population that is Hispanic in 3,143 counties in the US in 2010. Also shown is a histogram of logs of these values. 2000- 250 1500- 200 150 1000- 100 500- 50 O 20 40 60 80 100 -2 -1 0 2 3 Hispanic % log(% Hispanic) >40 20 (a) Describe the numerical distribution and comment on why we might want to use log-transformed values in analyzing or modeling these data. (b) What features of the distribution of the Hispanic population in US counties are apparent in the map but not in the histogram? What features are apparent in the histogram but not the map? (c) Is one visualization more appropriate or helpful than the other? Explain your reasoning
Step by Step Solution
There are 3 Steps involved in it

Get step-by-step solutions from verified subject matter experts