

Question: 1 Hispanic population The US census collecE data on race and ethnicityr of Americans, among manv other variables. The histogram below shows the distribution of
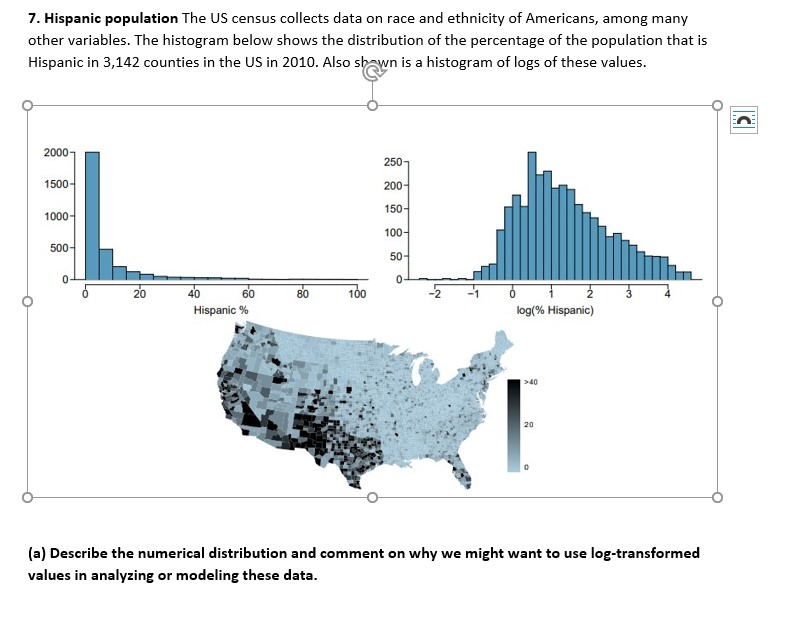
1 Hispanic population The US census collecE data on race and ethnicityr of Americans, among manv other variables. The histogram below shows the distribution of the percentage of the population that is Hispanic in 3,142 counties in the US in 201i}. Also 5 n is a histogram of logs of these values. {a} Describe the numerical distribution and comment on why we might want to use log-transformed values in analyzing or modeling these data
Step by Step Solution
There are 3 Steps involved in it
1 Expert Approved Answer
Step: 1 Unlock

Question Has Been Solved by an Expert!
Get step-by-step solutions from verified subject matter experts
Step: 2 Unlock
Step: 3 Unlock