

Question: (17%) Problem 3: A ball is launched up a ramp by a spring as shown in the figure at the right. At the time
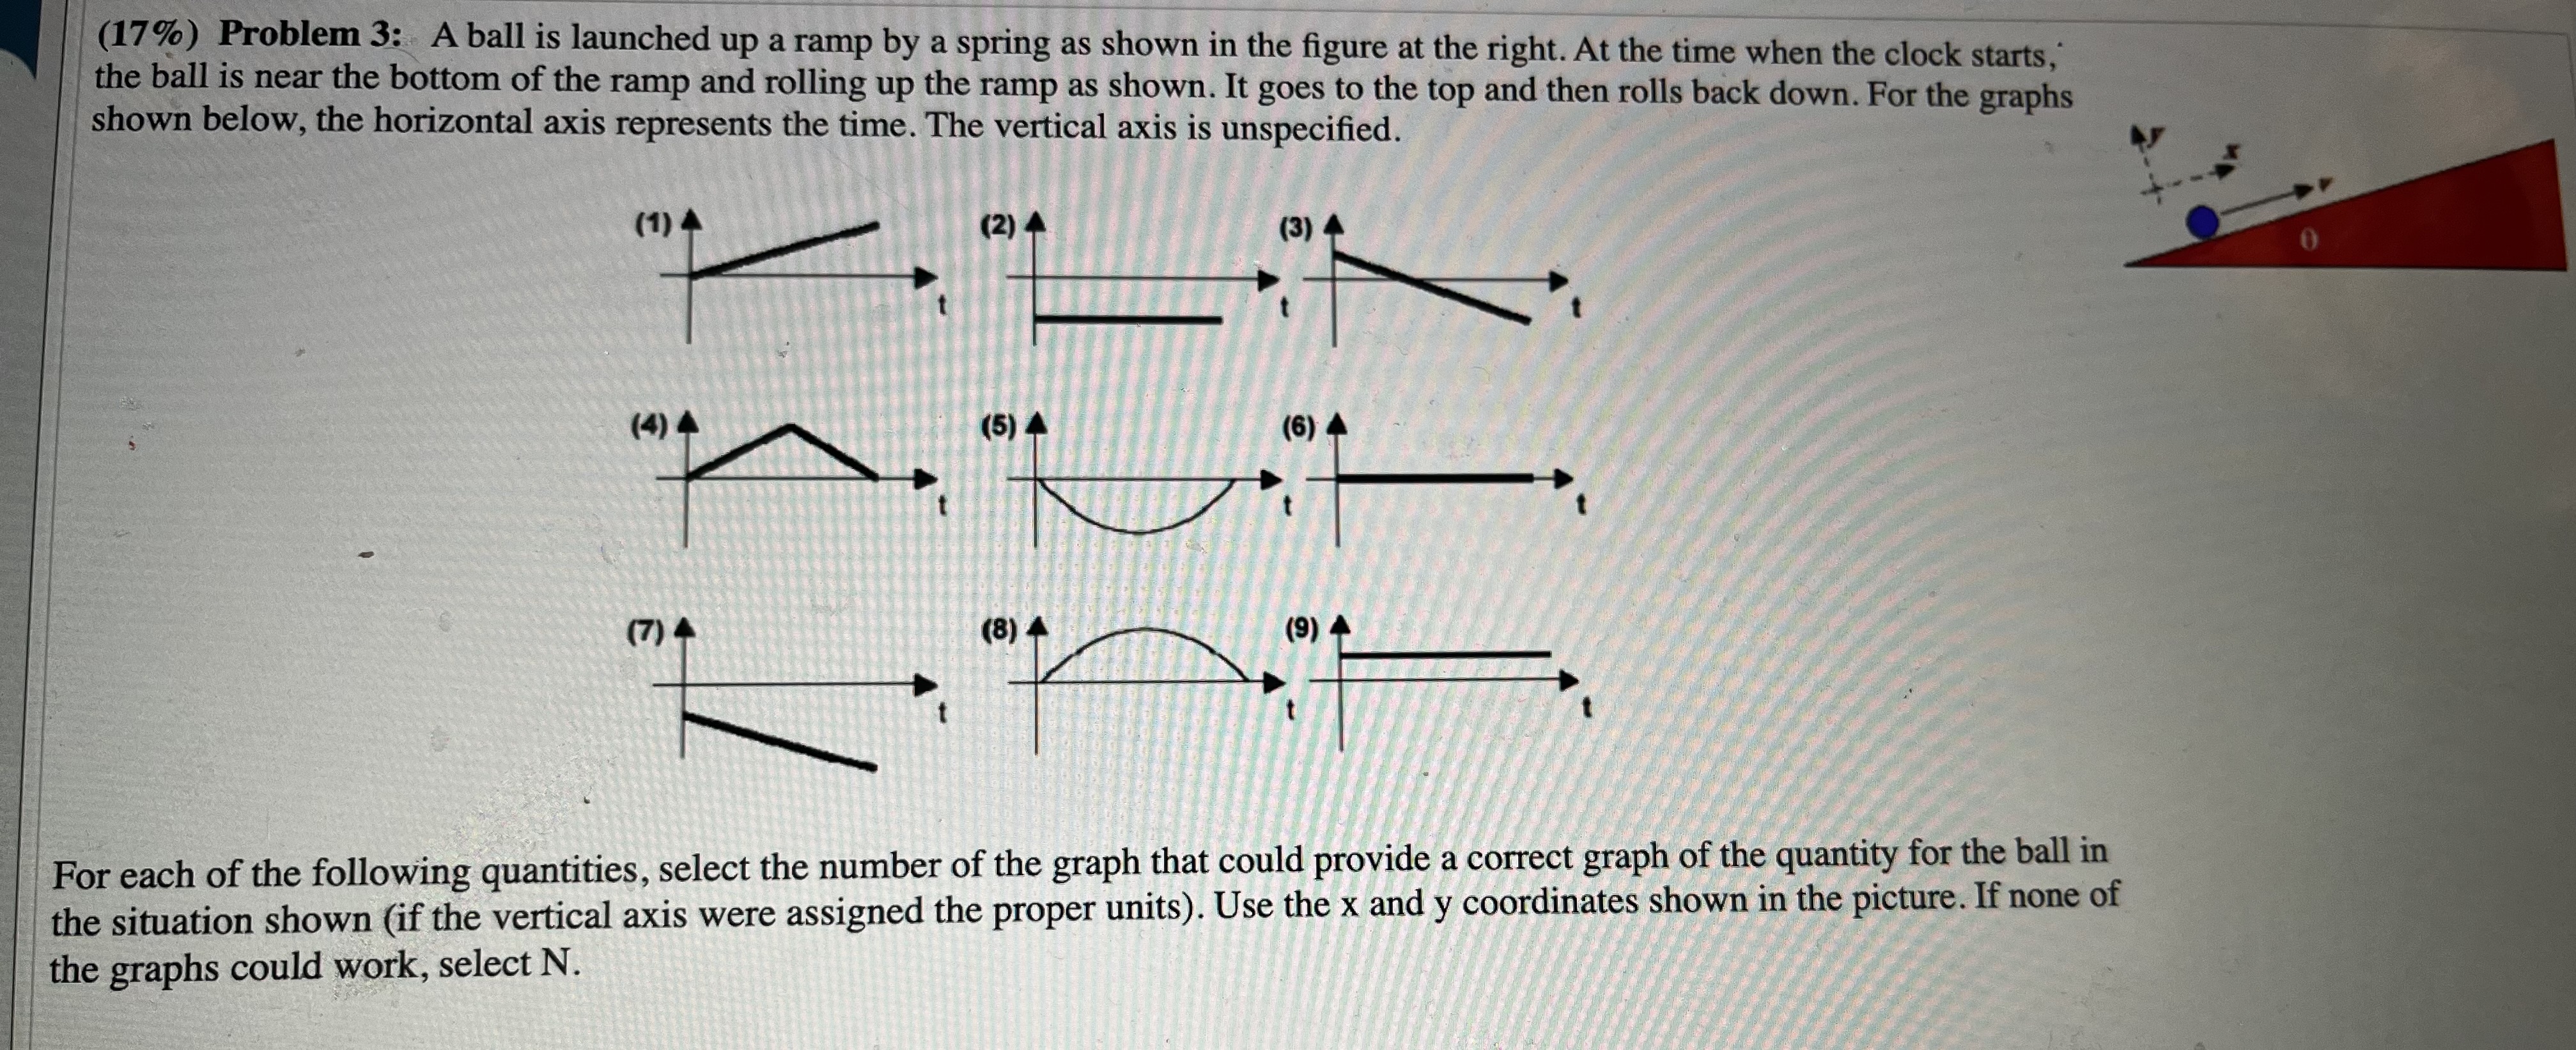
(17%) Problem 3: A ball is launched up a ramp by a spring as shown in the figure at the right. At the time when the clock starts, the ball is near the bottom of the ramp and rolling up the ramp as shown. It goes to the top and then rolls back down. For the graphs shown below, the horizontal axis represents the time. The vertical axis is unspecified. (1) A (2) A (3) (4) A (5) A (6) A (7)4 (8)4 (9) For each of the following quantities, select the number of the graph that could provide a correct graph of the quantity for the ball in the situation shown (if the vertical axis were assigned the proper units). Use the x and y coordinates shown in the picture. If none of the graphs could work, select N.
Step by Step Solution
There are 3 Steps involved in it

Get step-by-step solutions from verified subject matter experts