

Question: 1)Develop the estimated regression equation to explain the relationship between each of your three stocks' returns and that of the market. (2)Compute and explain the
1)Develop the estimated regression equation to explain the relationship between each of your three stocks' returns and that of the market. (2)Compute and explain the coefficient of determination for each stock. (3)Using ?=.05, can you conclude that the relationship you found between each of your stocks' returns and the market is statistically significant? (4)Interpret the company's market beta in light of the discussion provided. (5)Consider whether these results seem to confirm or contradict your conclusions from the first project.
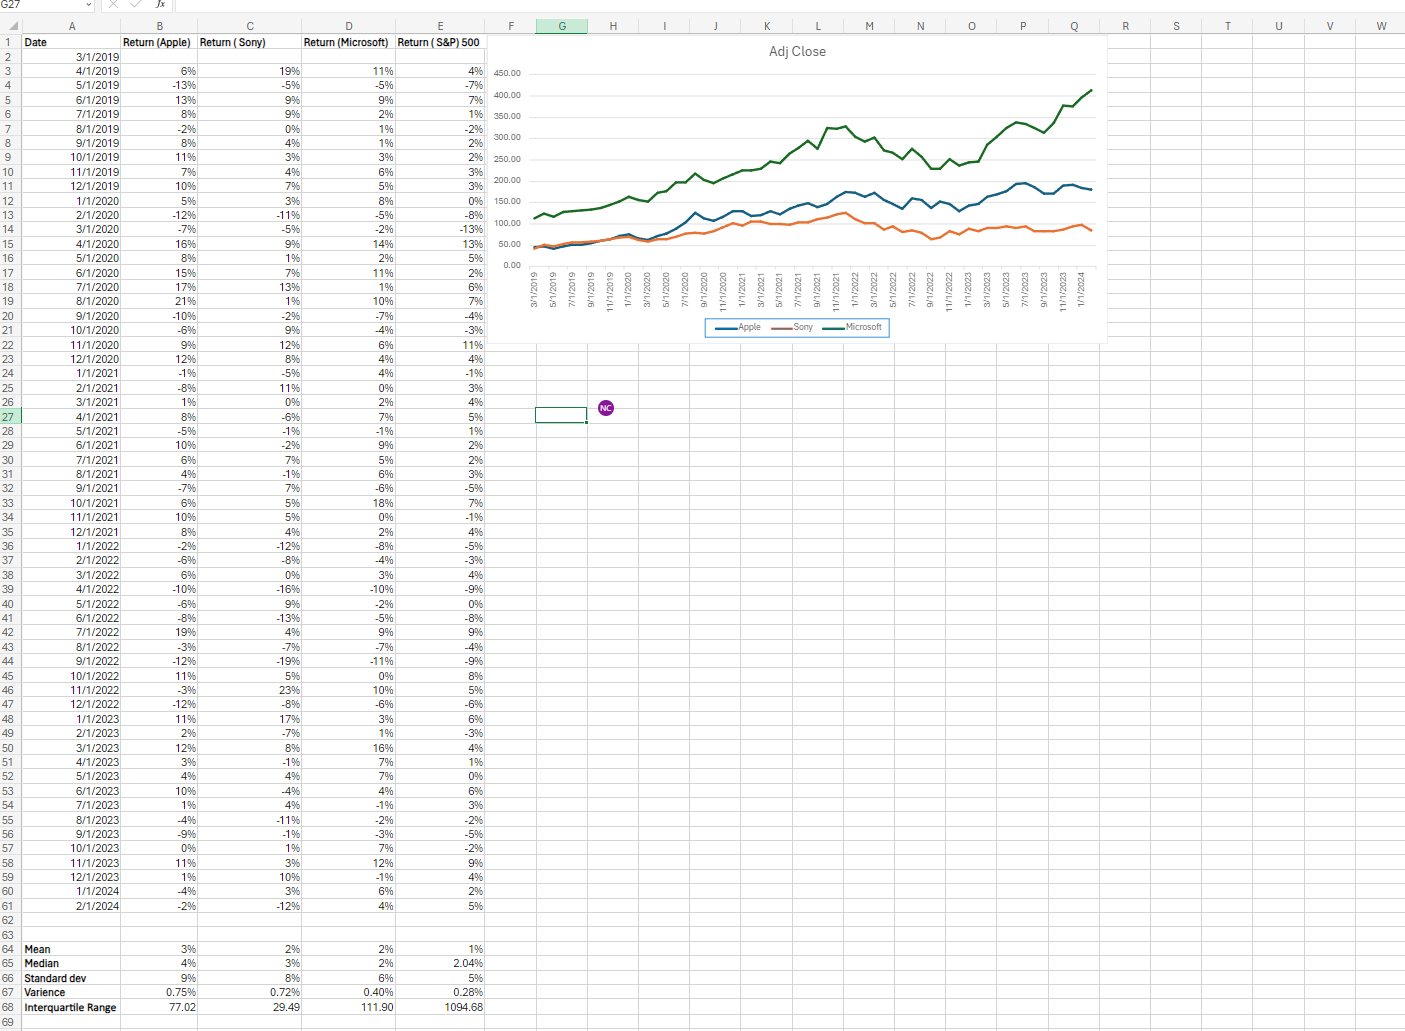
F I K M N 0 P Q R D G H Return (Microsoft) Return ( S&P) 500 Adj Close Date Return (Apple) Return ( Sony) 3/1/2019 1% 4%% 450.00 4/1/2019 6%% 19% CI A W N - -7% 5/1/2019 -13% -59% -5% 79% 400.00 5/1/2019 139% 996 9% 8% 996 2% 1% 350.00 7/1/2019 8/1/2019 -29% 096 1% -296 29% 300.00 1% 9/1/2019 8% 49% 11% 39% 3% 2% 250.00 10/1/2019 6% 3% 1/1/2019 79% 496 12/1/2019 06 79% 5% 3% 200.00 8% 1/1/2020 5% 39% 0% 150.00 2/1/2020 -12% -119% -5% -8% 100.00 8/1/2020 -7% -5% -2% -13% 13% 50.00 4/1/2020 16% 9% 14% 8% 19% 2% 59% 0.0 5/1/2020 296 1/1/2024 7/1/2023 7% 11% 9/1/2023 11/1/2023 5/1/2023 5/1/2022 1/1/2023 9/1/2022 3/1/2023 3/1/2022 7/1/2022 11/1/2022 11/1/2021 5/1/2020 15% 3/1/2021 1/1/2022 1/1/2021 5/1/2021 7/1/2021 9/1/2021 9/1/2020 6% 5/1/2020 9/1/2019 1/1/2020 3/1/2020 7/1/2020 5/1/2019 7/1/2019 11/1/2020 3/1/2019 11/1/2019 7/1/2020 17% 1396 1% 8/1/2020 21% 196 10% 79% 10% -296 -7% -49% - Apple -Sony -Microsoft 9/1/2020 10/1/2020 -6% 99% -4% - 3% 1 196 1/1/2020 9% 1296 6% 126 896 4% 49% 2/1/2020 -19% -59% 4% -19% 1/1/2021 39% 2/1/2021 -8% 1196 0% 3/1/202 19% 09% 2% 4% 4/1/2021 8% -6% 7% 59% - 5% -19% -1% 196 5/1/2021 5/1/202 10% -2% 9% 296 6% 79% 5% 7/1/2021 4% - 196 6% 396 8/1/2021 9/1/2021 -7% 79% -6% -59% 10/1/2021 6% 596 18% 59% 0% -19% 1/1/2021 10% 12/1/2021 8% 496 2% 46 -1296 -8% - 59% 1/1/2022 -2% -6% -89% -4% - 39% 2/1/2022 4% 3/1/2022 6% 096 3% 4/1/2022 -10% 16% 10% -9% 5/1/2022 -6% 9% -2% 0% 5/1/2022 -8% 13% -5% 9% 7/1/2022 19% 496 9% -7% -7% -4% 8/1/2022 -3% -9% 9/1/2022 -129% -196 1 1% 0% 10/1/2022 119% 5% 10% 59% 1/1/2022 -3% 23% -12% -8% -6% - 69% 2/1/2022 1/1/2023 119% 17% 3% 2% -79% 1% - 3% 2/1/2023 896 496 3/1/2023 12% 16% 4/1/2023 3% -1% 7% 19% 096 5/1/2023 4% 496 7% 10% -496 4% 696 6/1/2023 7/1/2023 1% 4% -1% 3% 4% -2% -296 8/1/2023 11% 9/1/2023 9% -1% -3% -596 10/1/2023 0% 196 7% -29% 11% 12% 9 9% 11/1/2023 396 109% -1% 496 2/1/2023 1% 1/1/2024 -4% 3% 6% 29% 4% 59% /1/2024 26 12% 64 290 Mean 39% 296 19% 4% 39% 2% 2.04% 65 Median 5% 66 Standard dev 9% 89% 6% 0.7296 0.40% 0.28% 67 Varience 0.75% 29.49 1094.68 68 Interquartile Range 77.02 111.90 69
Step by Step Solution
There are 3 Steps involved in it

Get step-by-step solutions from verified subject matter experts