

Question: 1.The second site plan attached below depicts a 20 x 40m block of land with a 5 x 5m grid shown in dotted lines. The
1.The second site plan attached below depicts a 20 x 40m block of land with a 5 x 5m grid shown in dotted lines. The grid is identified west to east with the numerals 1 to 5 and north to south A to I.
The table below gives the 'spot' levels taken on the grid points. The levels have been recorded to the nearest 10mm.
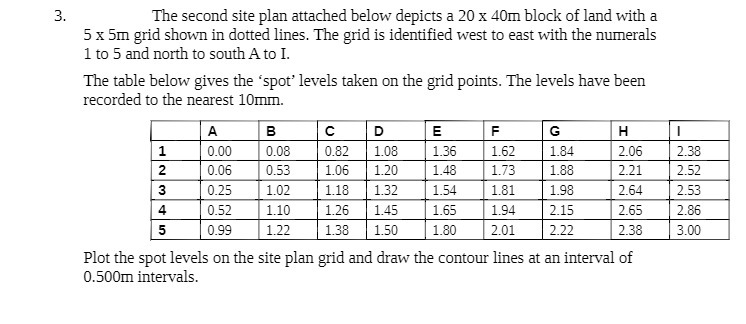

The second site plan attached below depicts a 2D x 4GB] hlock of land with a 5 E San grid shown in dotted lines. The grid is idened west to east with the numerals 1 to 5 and north to south Ato I. The table helow gives the 'spot' levels taken on the grid points. The levels have been recorded to the nearest ln'a'n. -ll-E--IE-I_l-_Il-I- mm mm E------_-- E-__-_-_-- mm Plot the spot levels on the site plan grid and draw the contour lines at an interval of esoom intervals. \f
Step by Step Solution
There are 3 Steps involved in it

Get step-by-step solutions from verified subject matter experts