

Question: 3. The second site plan attached below depicts a 20 x 40m block of land with a 5 x 5m grid shown in dotted lines.
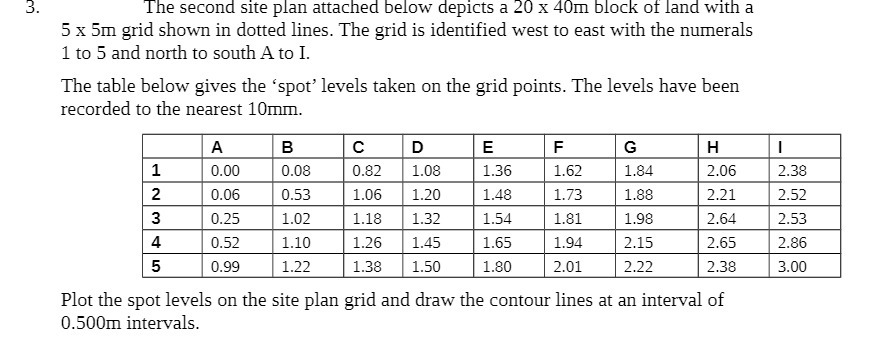
3. The second site plan attached below depicts a 20 x 40m block of land with a 5 x 5m grid shown in dotted lines. The grid is identified west to east with the numerals 1 to 5 and north to south A to I. The table below gives the 'spot' levels taken on the grid points. The levels have been recorded to the nearest 10mm. A B C D E F G H = 1 0.00 0.08 0.82 1.08 1.36 1.62 1.84 2.06 2.38 2 0.06 0.53 1.06 1.20 1.48 1.73 1.88 2.21 2.52 3 0.25 1.02 1.18 1.32 1.54 1.81 1.98 2.64 2.53 4 0.52 1.10 1.26 1.45 1.65 1.94 2.15 2.65 2.86 5 0.99 1.22 1.38 1.50 1.80 2.01 2.22 2.38 3.00 Plot the spot levels on the site plan grid and draw the contour lines at an interval of 0.500m intervals
Step by Step Solution
There are 3 Steps involved in it

Get step-by-step solutions from verified subject matter experts