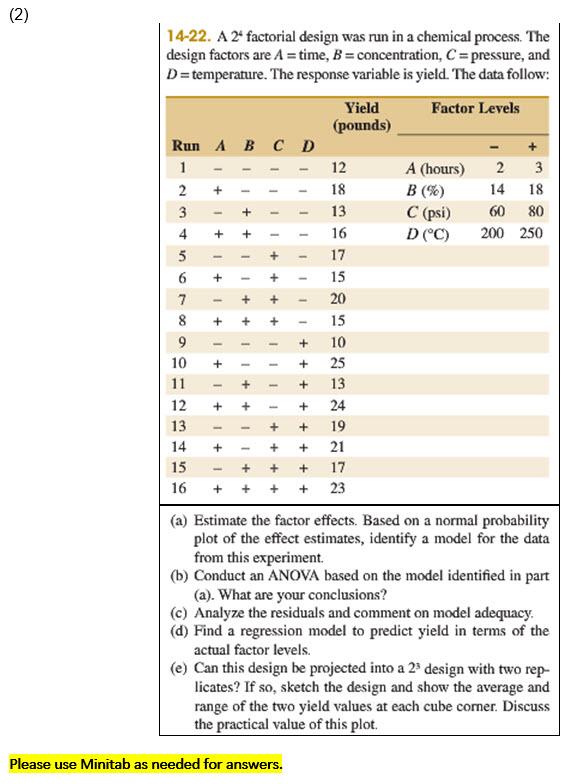
Question: (2) + > - 14-22. A 24 factorial design was run in a chemical process. The design factors are A = time, B = concentration,

(2) + > - 14-22. A 24 factorial design was run in

(2) + > - 14-22. A 24 factorial design was run in a chemical process. The design factors are A = time, B = concentration, C = pressure, and D=temperature. The response variable is yield. The data follow: Yield Factor Levels (pounds) Run A B C D 1 12 A (hours) 2 3 2 18 B (%) 14 18 3 13 C (psi) 60 80 4 16 D(C) 200 250 5 17 6 15 7 20 8 15 9 10 25 11 13 12 24 19 14 21 15 + 17 16 + + 23 (a) Estimate the factor effects. Based on a normal probability plot of the effect estimates, identify a model for the data from this experiment (b) Conduct an ANOVA based on the model identified in part (a). What are your conclusions? (c) Analyze the residuals and comment on model adequacy. (d) Find a regression model to predict yield in terms of the actual factor levels. (e) Can this design be projected into a 23 design with two rep- licates? If so, sketch the design and show the average and range of the two yield values at each cube comer. Discuss the practical value of this plot, 1 + + + + + 11 + + + + + + 1 + + IIII + + + + III IIIIIII + + + + + + 10 13 + + Please use Minitab as needed for answers. (2) + > - 14-22. A 24 factorial design was run in a chemical process. The design factors are A = time, B = concentration, C = pressure, and D=temperature. The response variable is yield. The data follow: Yield Factor Levels (pounds) Run A B C D 1 12 A (hours) 2 3 2 18 B (%) 14 18 3 13 C (psi) 60 80 4 16 D(C) 200 250 5 17 6 15 7 20 8 15 9 10 25 11 13 12 24 19 14 21 15 + 17 16 + + 23 (a) Estimate the factor effects. Based on a normal probability plot of the effect estimates, identify a model for the data from this experiment (b) Conduct an ANOVA based on the model identified in part (a). What are your conclusions? (c) Analyze the residuals and comment on model adequacy. (d) Find a regression model to predict yield in terms of the actual factor levels. (e) Can this design be projected into a 23 design with two rep- licates? If so, sketch the design and show the average and range of the two yield values at each cube comer. Discuss the practical value of this plot, 1 + + + + + 11 + + + + + + 1 + + IIII + + + + III IIIIIII + + + + + + 10 13 + + Please use Minitab as needed for answers

Step by Step Solution

There are 3 Steps involved in it

1 Expert Approved Answer
Step: 1 Unlock blur-text-image
Question Has Been Solved by an Expert!

Get step-by-step solutions from verified subject matter experts

Step: 2 Unlock
Step: 3 Unlock

Students Have Also Explored These Related General Management Questions!