

Question: 2 . 5 6 . On a five - cycle semilogarithmic graph, plot the grain size distributions of soils A - F . From the
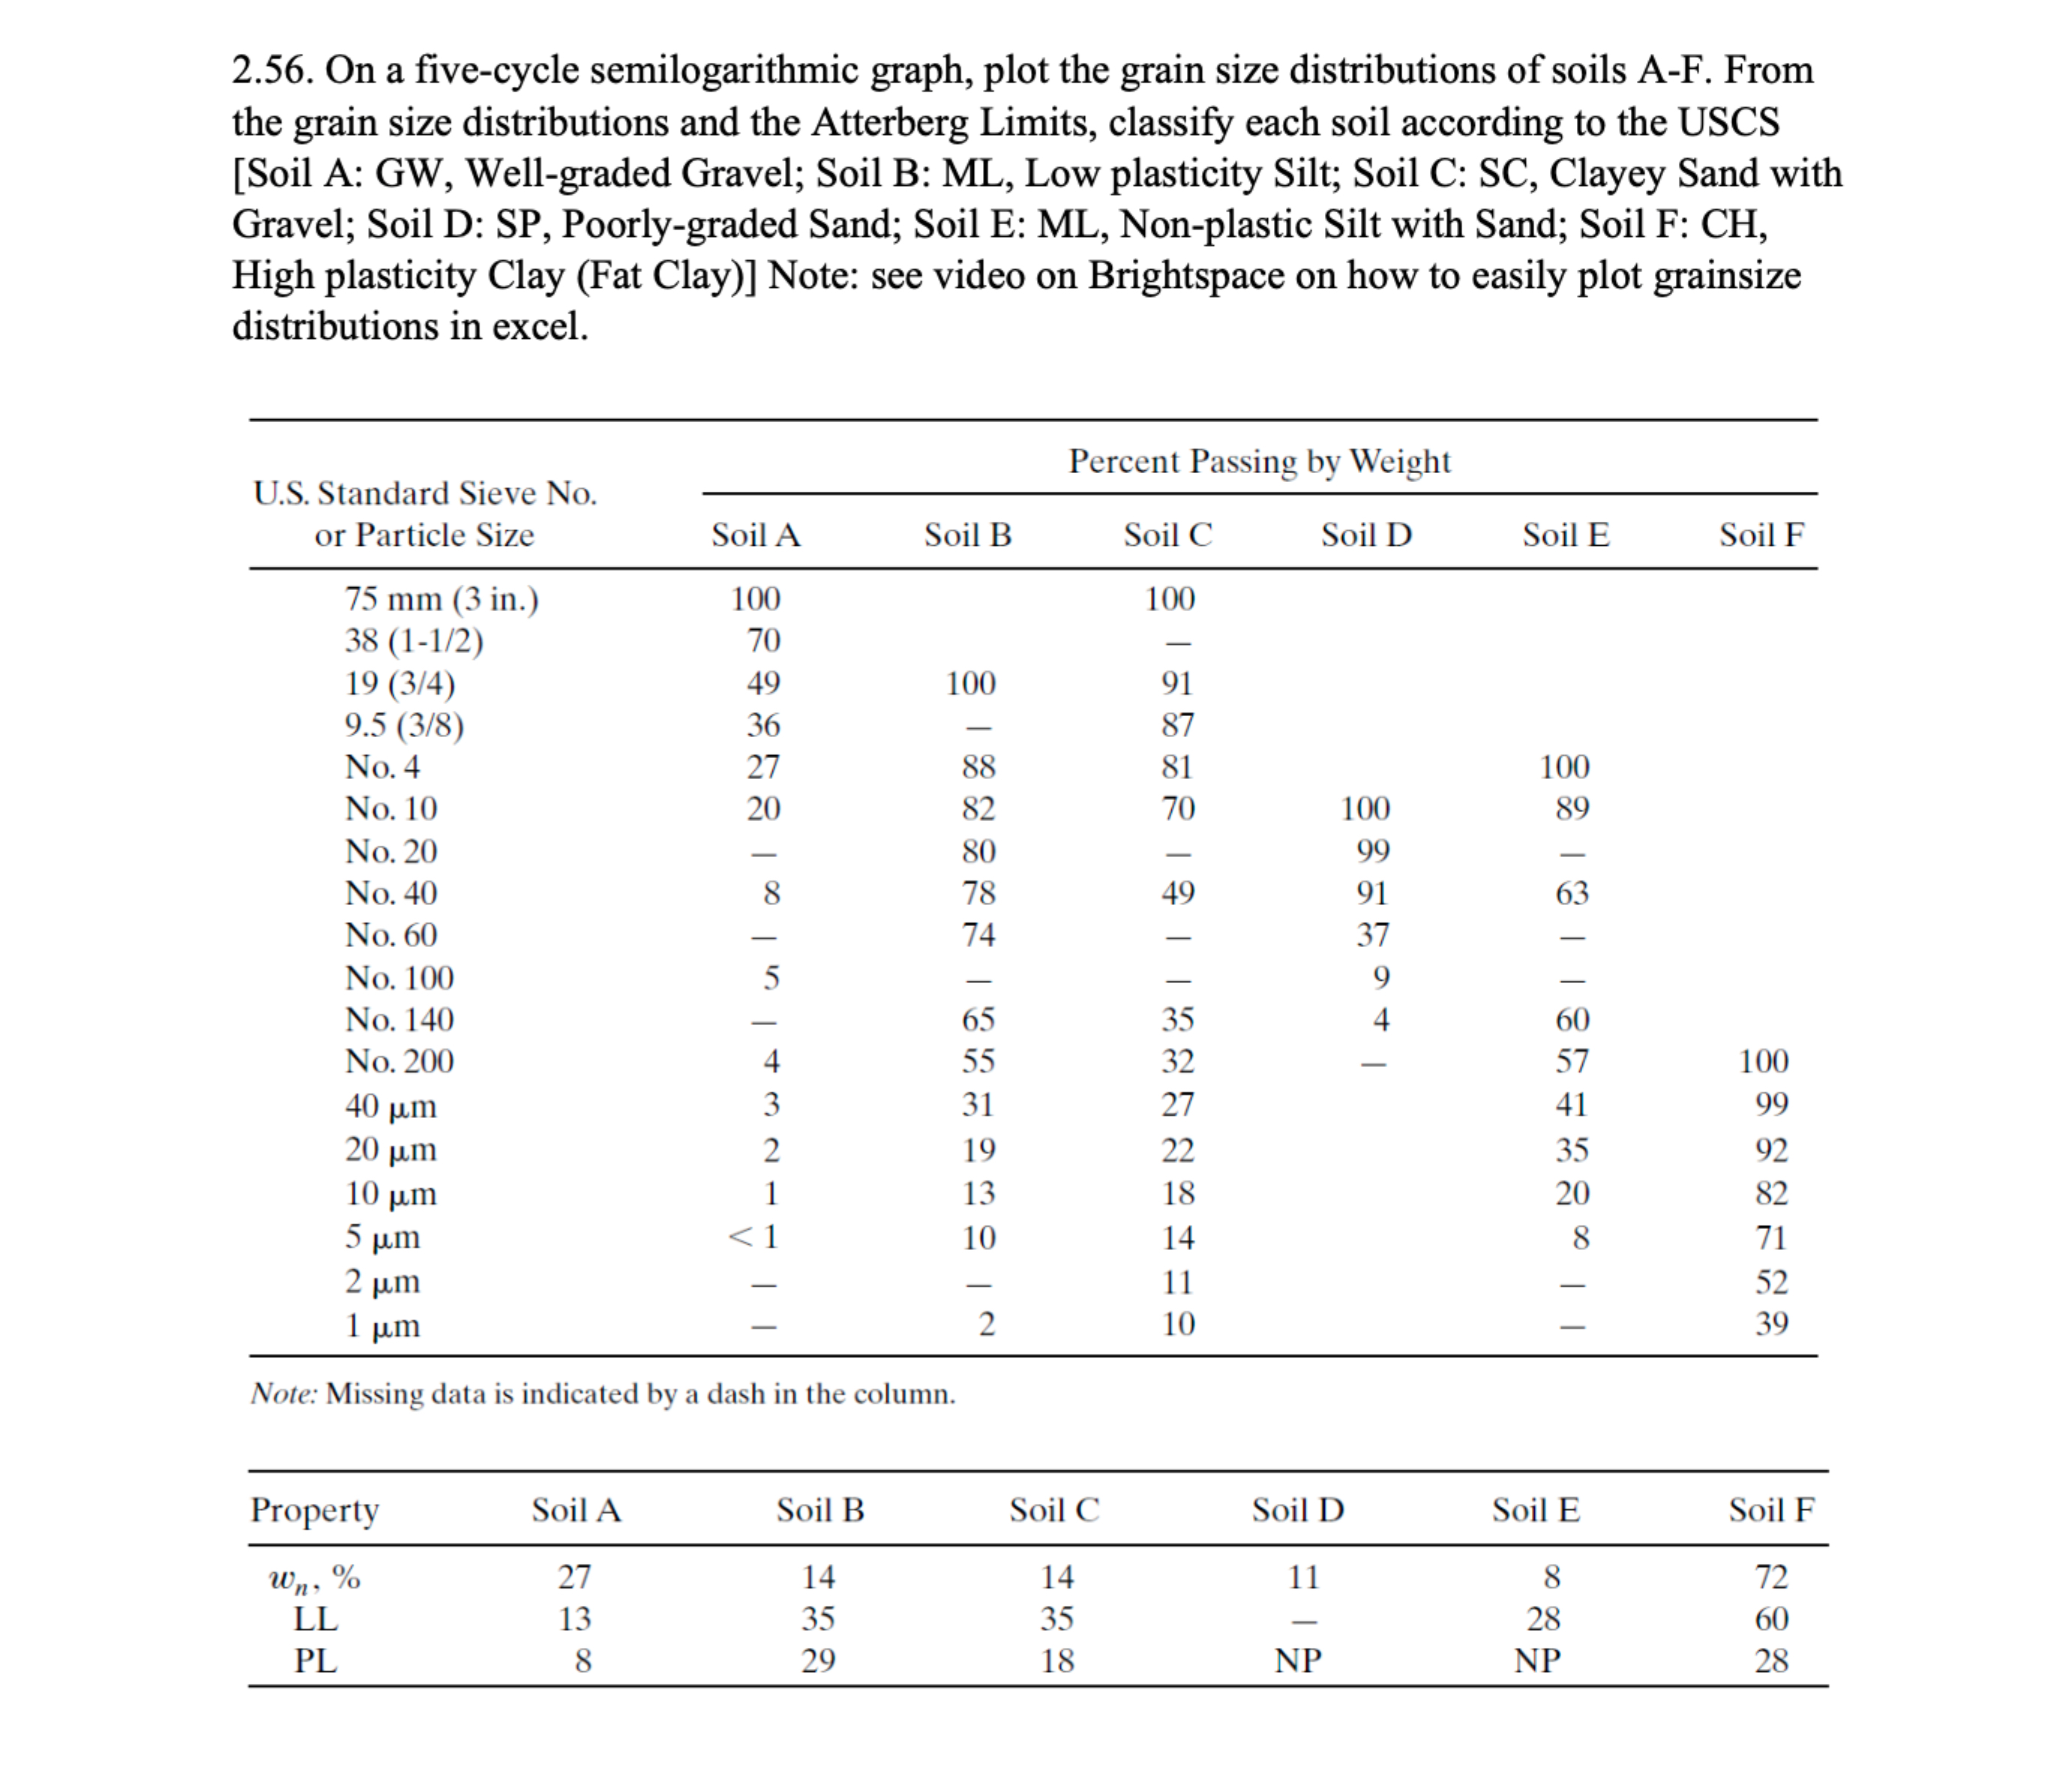
On a fivecycle semilogarithmic graph, plot the grain size distributions of soils AF From the grain size distributions and the Atterberg Limits, classify each soil according to the USCS Soil A: GW Wellgraded Gravel; Soil B: ML Low plasticity Silt; Soil C: SC Clayey Sand with Gravel; Soil D: SP Poorlygraded Sand; Soil E: ML Nonplastic Silt with Sand; Soil F: CH High plasticity Clay Fat Clay Note: see video on Brightspace on how to easily plot grainsize distributions in excel.
tabletableUS Standard Sieve Noor Particle SizePercent Passing by WeightSoil ASoil BSoil CSoil DSoil ESoil F mm inNoNoNoNoNoNoNoNomu mmu mmu mmu mmu mmu m
Note: Missing data is indicated by a dash in the column.
tablePropertySoil ASoil BSoil CSoil DSoil ESoil FwnLLPLNPNP
Step by Step Solution
There are 3 Steps involved in it
1 Expert Approved Answer
Step: 1 Unlock

Question Has Been Solved by an Expert!
Get step-by-step solutions from verified subject matter experts
Step: 2 Unlock
Step: 3 Unlock