

Question: 2. A bar chart schedule for a project is shown below along with the estimated cost for each activity. The schedule shows the planned timing
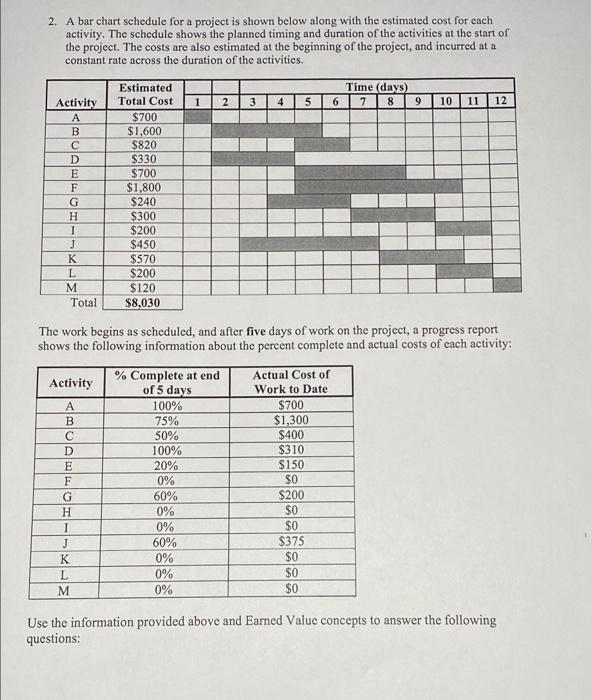
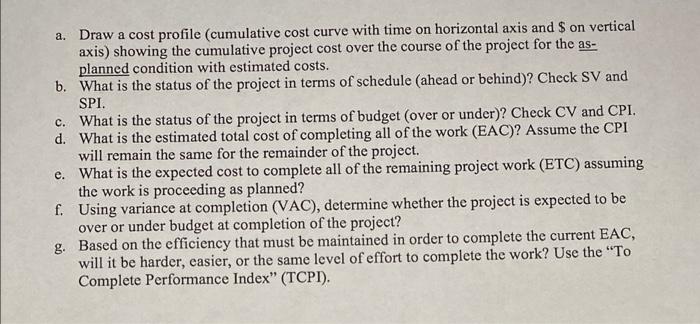
2. A bar chart schedule for a project is shown below along with the estimated cost for each activity. The schedule shows the planned timing and duration of the activities at the start of the project. The costs are also estimated at the beginning of the project, and incurred at a constant rate across the duration of the activities. Time (days) 7 8 9 1 2 3 4 5 6 10 11 12 Activity A B C D E F G H I J K L M Total Estimated Total Cost $700 $1,600 $820 $330 $700 $1,800 $240 $300 $200 $450 $570 $200 $120 $8,030 The work begins as scheduled, and after five days of work on the project, a progress report shows the following information about the percent complete and actual costs of each activity: Activity % Complete at end Actual Cost of of 5 days Work to Date 100% $700 75% $1,300 50% $400 100% $310 20% $150 0% $0 60% $200 0% SO 0% $0 60% $375 0% $0 0% SO 0% $0
Step by Step Solution
There are 3 Steps involved in it

Get step-by-step solutions from verified subject matter experts