

Question: A bar chart schedule for a project is shown below along with the estimated cost for each activity. The schedule shows the planned timing
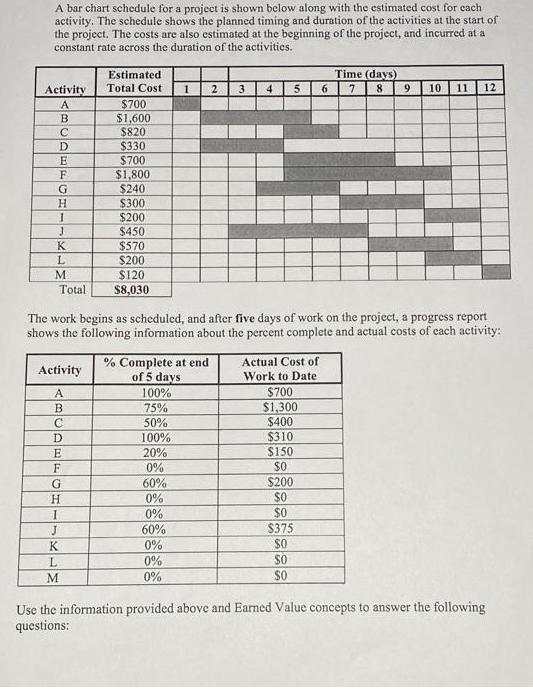
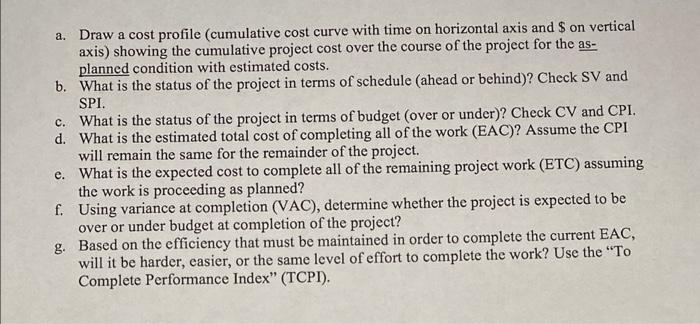
A bar chart schedule for a project is shown below along with the estimated cost for each activity. The schedule shows the planned timing and duration of the activities at the start of the project. The costs are also estimated at the beginning of the project, and incurred at a constant rate across the duration of the activities. Estimated Time (days) 7 Activity Total Cost 1 2 3 4 5 6 8 9 10 11 12 $700 $1,600 $820 $330 $700 $1,800 $240 $300 $200 $450 $570 $200 $120 Total $8,030 The work begins as scheduled, and after five days of work on the project, a progress report shows the following information about the percent complete and actual costs of each activity: % Complete at end Actual Cost of Activity of 5 days Work to Date A 100% $700 B 75% $1,300 C 50% $400 D 100% $310 E 20% $150 F 0% $0. G 60% $200 H 0% SO I 0% $0 J 60% $375 K 0% $0 L 0% SO M 0% $0 Use the information provided above and Earned Value concepts to answer the following questions: ABCDEFGH 1 K L M a. Draw a cost profile (cumulative cost curve with time on horizontal axis and $ on vertical axis) showing the cumulative project cost over the course of the project for the as- planned condition with estimated costs. b. What is the status of the project in terms of schedule (ahead or behind)? Check SV and SPI. d. c. What is the status of the project in terms of budget (over or under)? Check CV and CPI. What is the estimated total cost of completing all of the work (EAC)? Assume the CPI will remain the same for the remainder of the project. e. What is the expected cost to complete all of the remaining project work (ETC) assuming the work is proceeding as planned? f. Using variance at completion (VAC), determine whether the project is expected to be over or under budget at completion of the project? g. Based on the efficiency that must be maintained in order to complete the current EAC, will it be harder, easier, or the same level of effort to complete the work? Use the "To Complete Performance Index" (TCPI).
Step by Step Solution
3.37 Rating (178 Votes )
There are 3 Steps involved in it
a Cost profile See graph on next page Budgeted at completion BAC for all activities 1745 After 4 wee... View full answer

Get step-by-step solutions from verified subject matter experts