

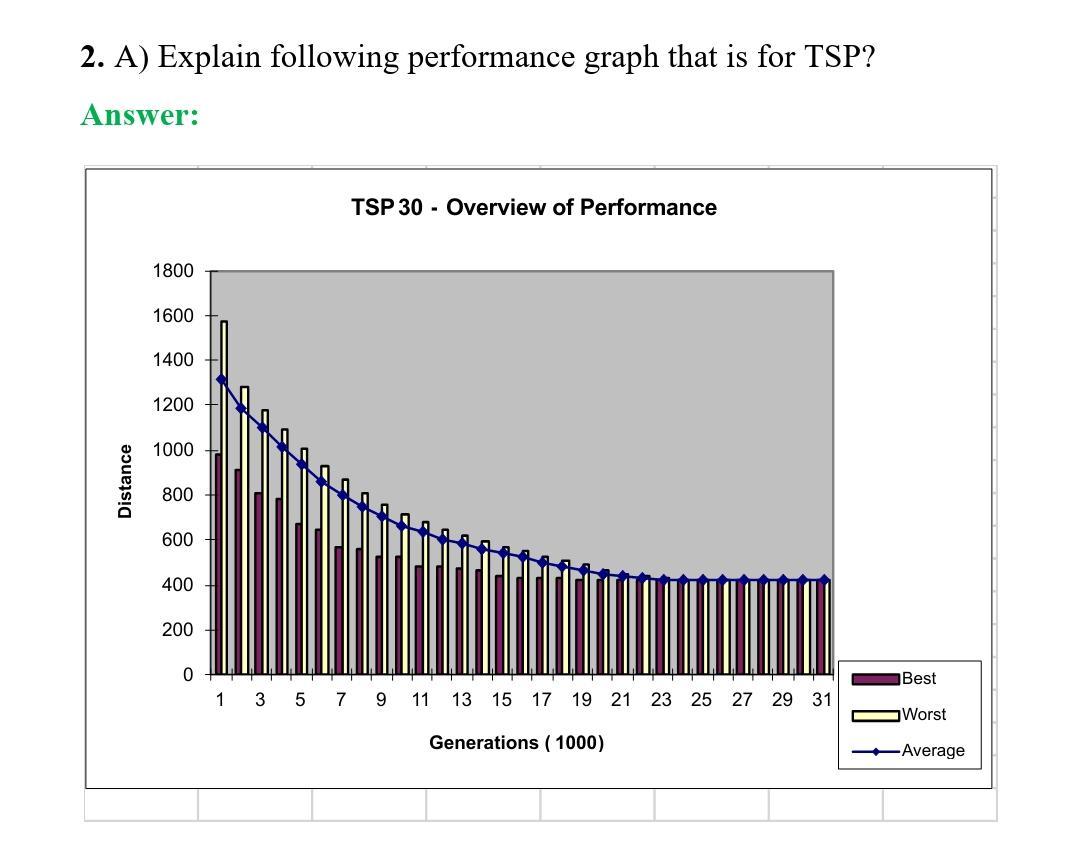
Question: 2. A) Explain following performance graph that is for TSP? Answer: TSP 30 - Overview of Performance 1800 1600 1400 1200 1000 Distance 800 600
Step by Step Solution
There are 3 Steps involved in it
1 Expert Approved Answer
Step: 1 Unlock

Question Has Been Solved by an Expert!
Get step-by-step solutions from verified subject matter experts
Step: 2 Unlock
Step: 3 Unlock