

Question: 2. An article shows data to compare several methods for predicting the shear 2.3. (2 points) Do the data suggest that the two methods provide
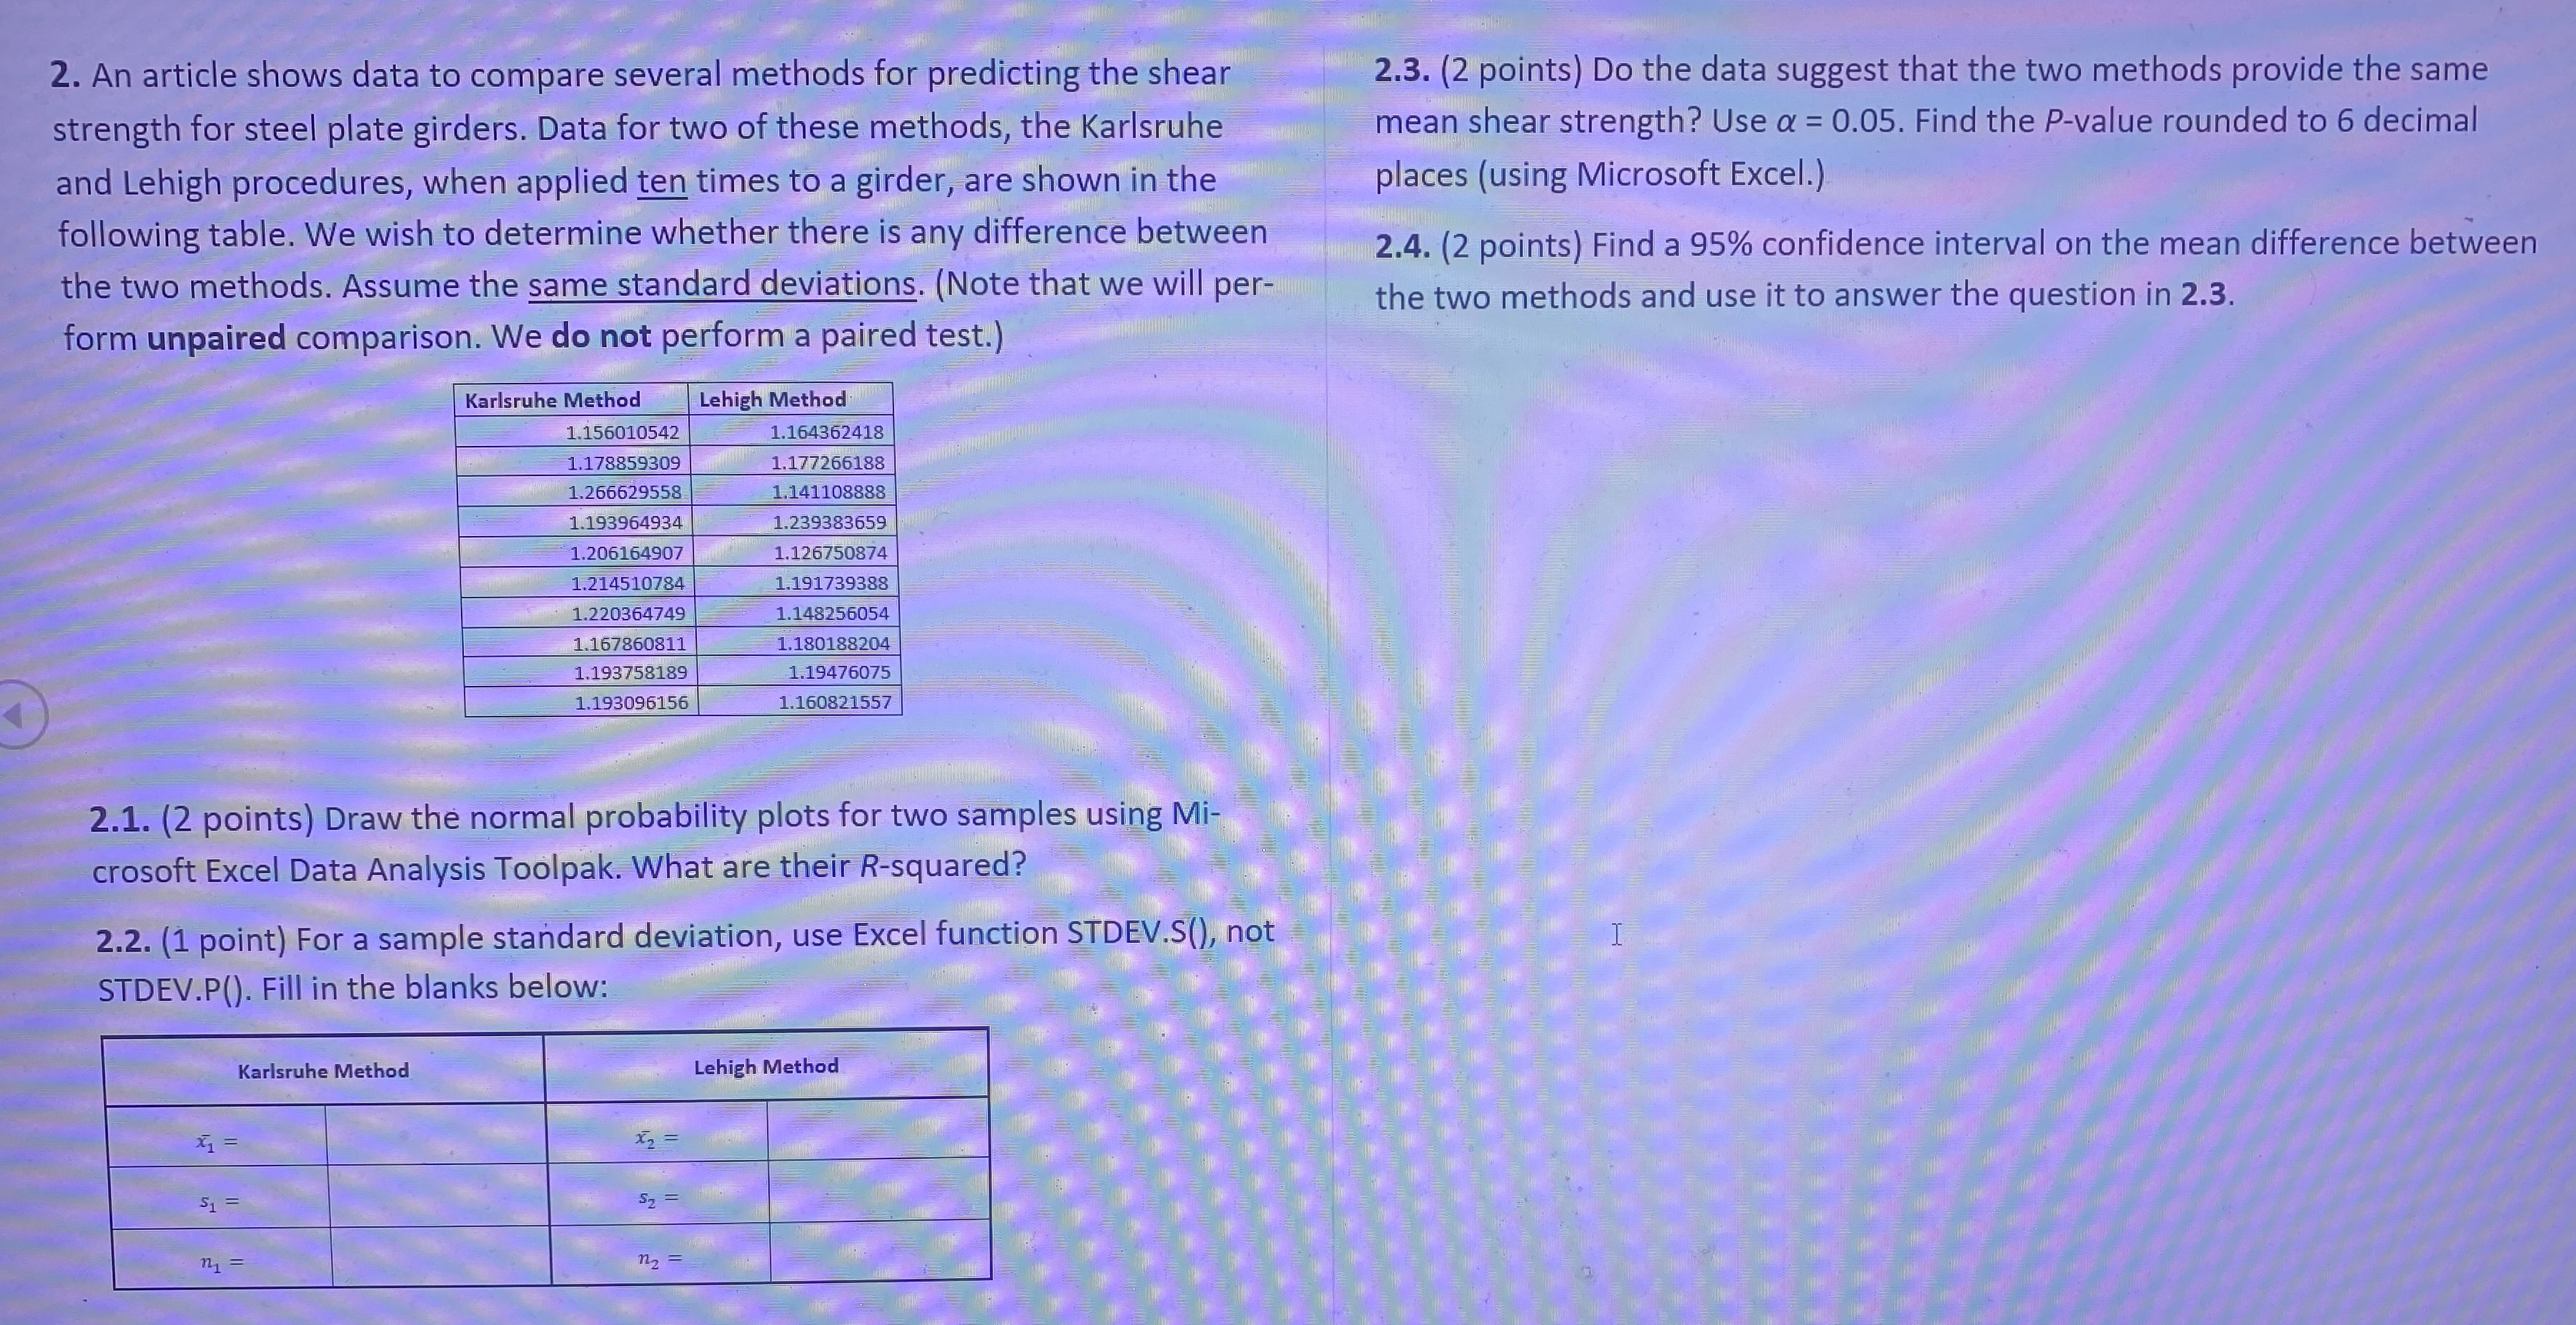
2. An article shows data to compare several methods for predicting the shear 2.3. (2 points) Do the data suggest that the two methods provide the same strength for steel plate girders. Data for two of these methods, the Karlsruhe mean shear strength? Use a = 0.05. Find the P-value rounded to 6 decimal and Lehigh procedures, when applied ten times to a girder, are shown in the places (using Microsoft Excel.) following table. We wish to determine whether there is any difference between 2.4. (2 points) Find a 95% confidence interval on the mean difference between the two methods. Assume the same standard deviations. (Note that we will per- the two methods and use it to answer the question in 2.3. form unpaired comparison. We do not perform a paired test.) Karlsruhe Method Lehigh Method 1.156010542 1.164362418 1.178859309 1.177266188 1.266629558 1.141108888 1.193964934 1.239383659 1.206164907 1.126750874 1.214510784 1.191739388 1.220364749 1.148256054 1.167860811 1.180188204 1.193758189 1.19476075 1.193096156 1.160821557 2.1. (2 points) Draw the normal probability plots for two samples using Mi- crosoft Excel Data Analysis Toolpak. What are their R-squared? 2.2. (1 point) For a sample standard deviation, use Excel function STDEV.S(), not STDEV.P(). Fill in the blanks below: Karlsruhe Method Lehigh Method = X2 = HA 51 = m1 = 1 =
Step by Step Solution
There are 3 Steps involved in it

Get step-by-step solutions from verified subject matter experts