

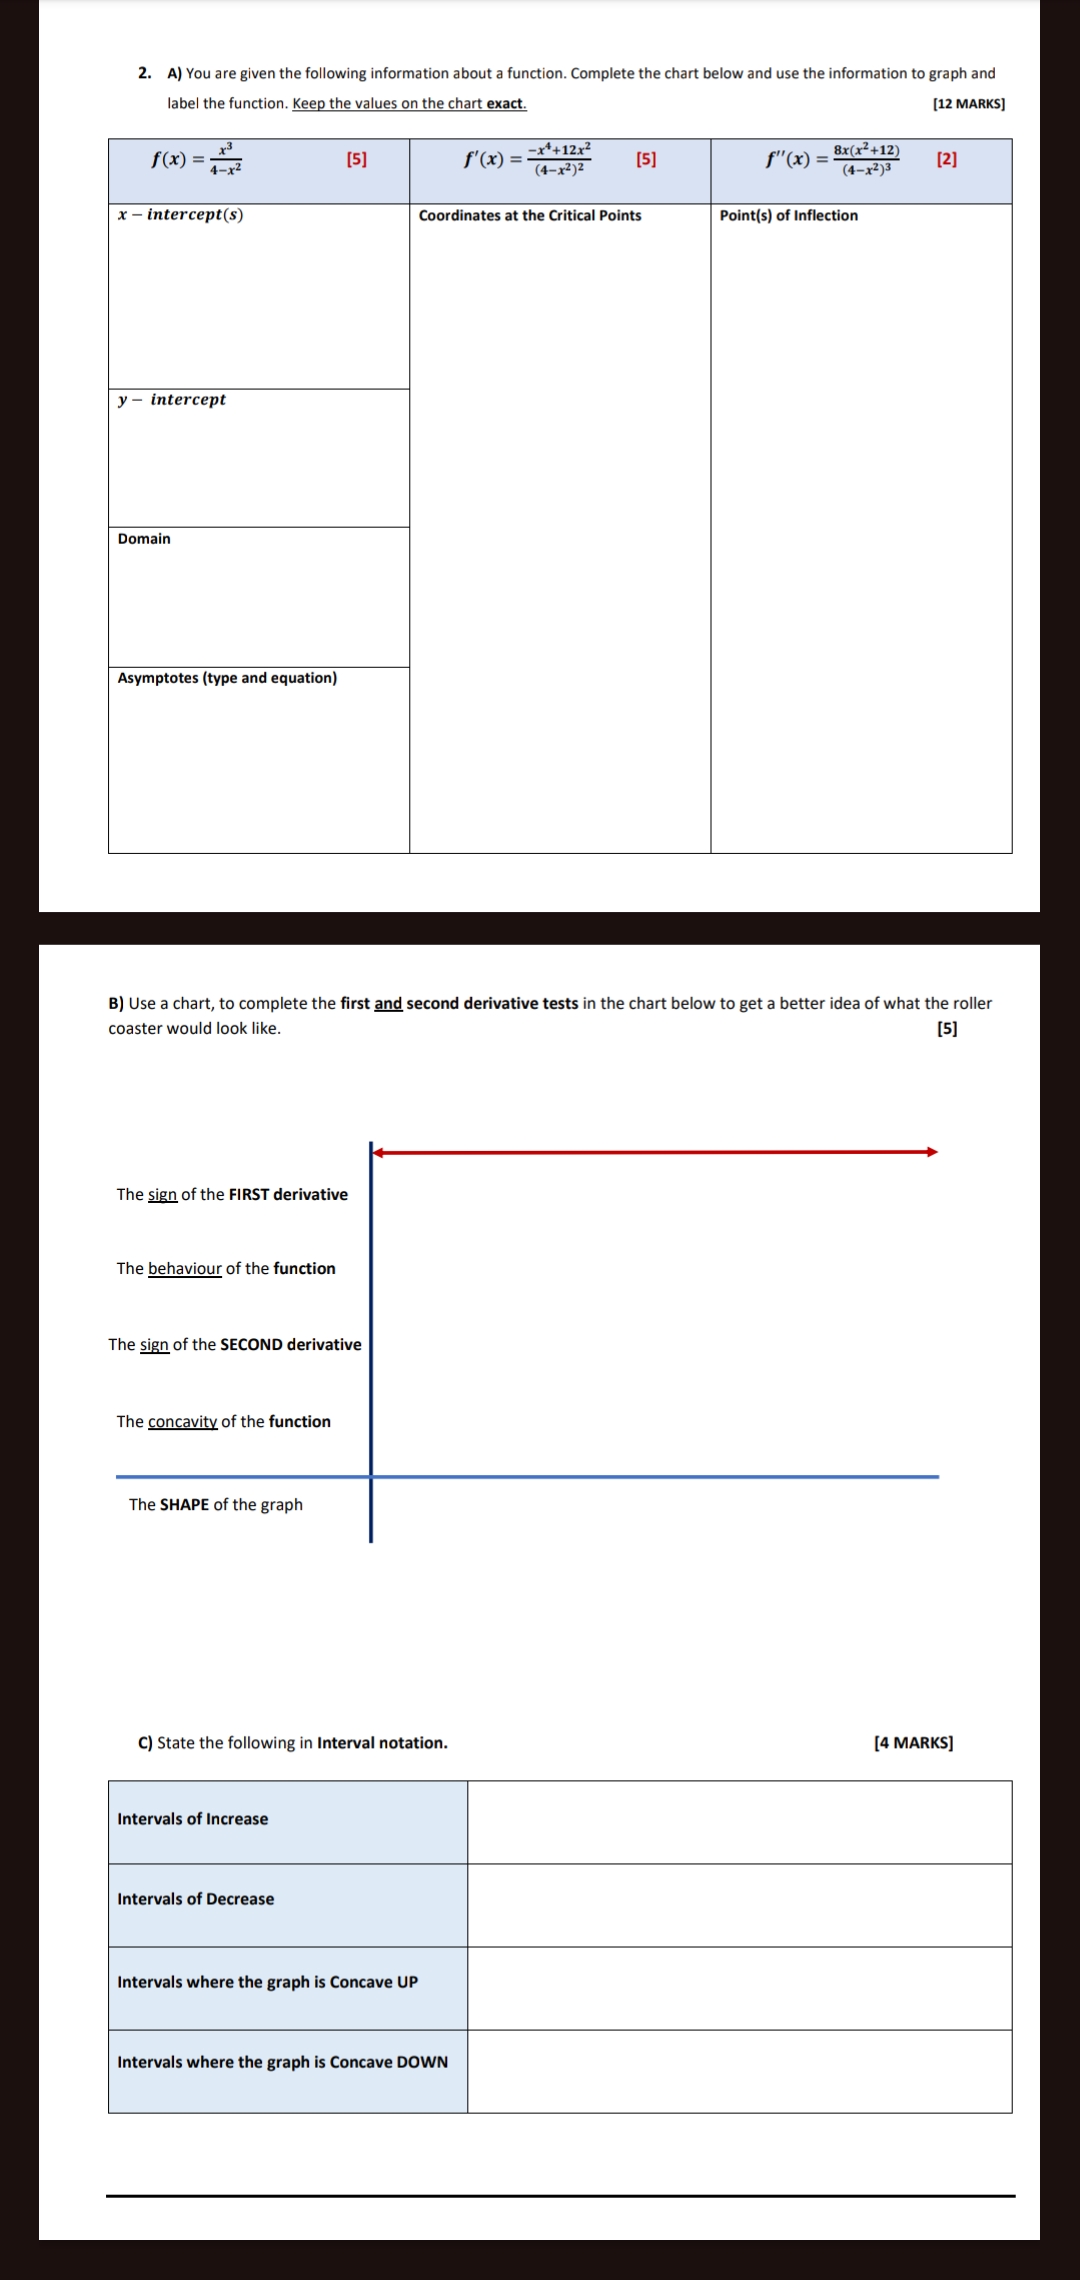
Question: 2. A)You are given the following information about a function. Complete the chart below and use the information to graph and label the function. Keep
![function. Keep the values on the chart exact. [12 MARKS] 3 4](https://dsd5zvtm8ll6.cloudfront.net/si.experts.images/questions/2024/10/6708ce03a2ac2_2756708ce0374956.jpg)
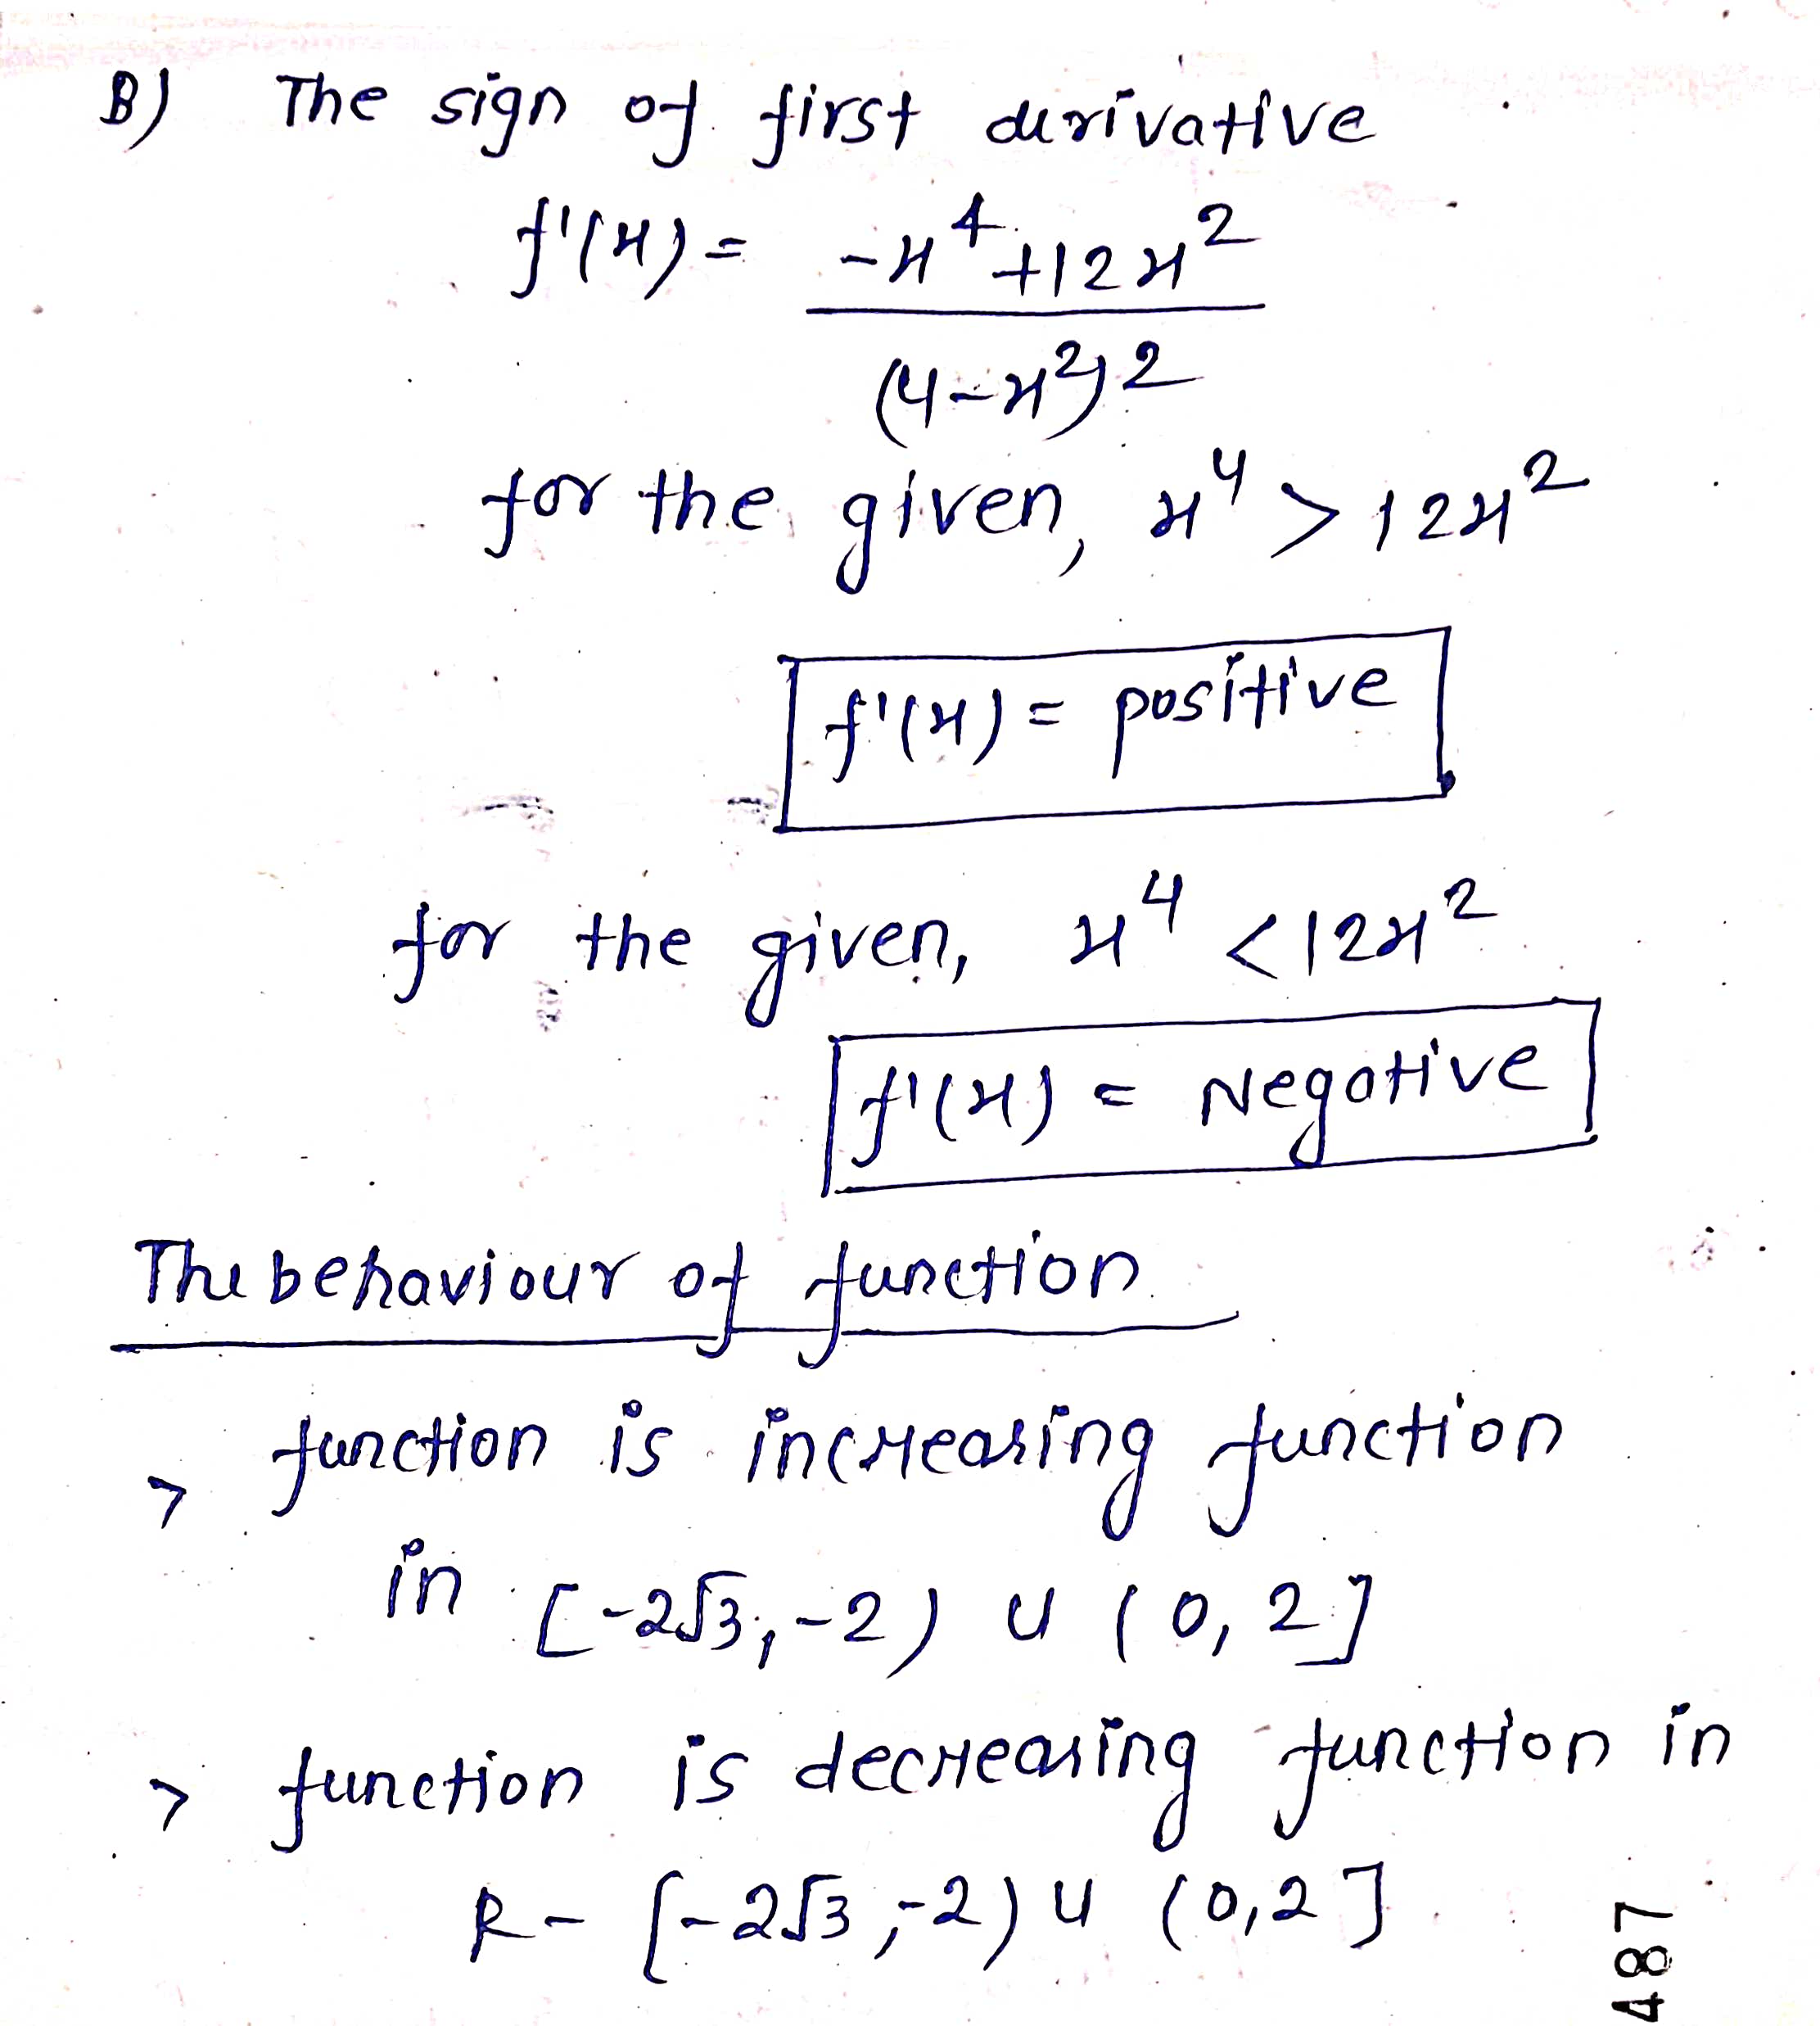
2. A)You are given the following information about a function. Complete the chart below and use the information to graph and label the function. Keep the values on the chart exact. [12 MARKS] 3 4 2 ' x*4+12x - Bx(x2+12) = == =2 2 fx) =2 [s1 re=22 [ Fo=2E28 ) x intercept(s) Coordinates at the Critical Points Point(s) of Inflection y intercept Domain Asymptotes (type and equation) B) Use a chart, to complete the first and second derivative tests in the chart below to get a better idea of what the roller coaster would look like. 18] The sign of the FIRST derivative The behaviour of the function The sign of the SECOND derivative The concavity of the function The SHAPE of the graph C) State the following in Interval notation. [4 MARKS] Intervals of Increase Intervals of Decrease Intervals where the graph is Concave UP Intervals where the graph is Concave DOWN B ) The sign of first dirivative ( 4 - 2132 for the given, * " 43 1242 f' 14 ) = positive for the given , 27 +" ( x ) is always [-2,2] positive The concavity of function - function is concave up in (_00, - 2 ) 4 ( 0 , 2 ) & function is concave down. in [- 2, 0 ) u ( 200)
Step by Step Solution
There are 3 Steps involved in it

Get step-by-step solutions from verified subject matter experts