

Question: 2. Based on the information below, construct a standard curve for BSA. Use a white background for your curve. Be sure that the standard curve
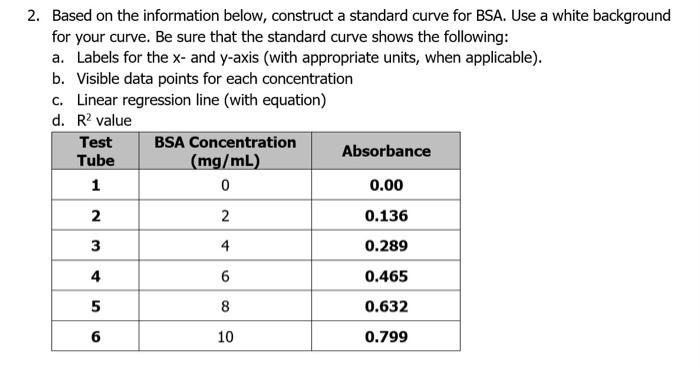
2. Based on the information below, construct a standard curve for BSA. Use a white background for your curve. Be sure that the standard curve shows the following: a. Labels for the x- and y-axis (with appropriate units, when applicable). b. Visible data points for each concentration C. Linear regression line (with equation) d. R2 value Test BSA Concentration Tube (mg/mL) Absorbance 1 0 0.00 2 2 0.136 3 4 0.289 4 4 6 0.465 5 8 0.632 6 6 10 0.799
Step by Step Solution
There are 3 Steps involved in it
1 Expert Approved Answer
Step: 1 Unlock

Question Has Been Solved by an Expert!
Get step-by-step solutions from verified subject matter experts
Step: 2 Unlock
Step: 3 Unlock