

Question: 2. The data in the table below were collected using a 1.5mg/mL solution of bovine serum albumin (BSA) in the Bradford protein assay (4). Use
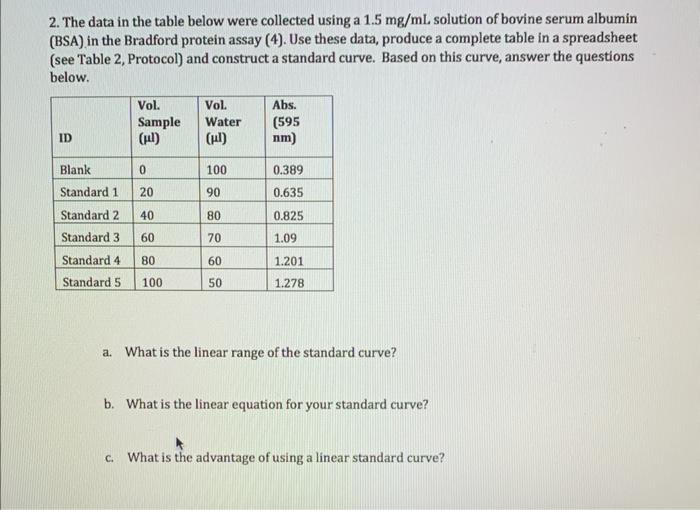
2. The data in the table below were collected using a 1.5mg/mL solution of bovine serum albumin (BSA) in the Bradford protein assay (4). Use these data, produce a complete table in a spreadsheet (see Table 2, Protocol) and construct a standard curve. Based on this curve, answer the questions below. a. What is the linear range of the standard curve? b. What is the linear equation for your standard curve? c. What is the advantage of using a linear standard curve
Step by Step Solution
There are 3 Steps involved in it
1 Expert Approved Answer
Step: 1 Unlock

Question Has Been Solved by an Expert!
Get step-by-step solutions from verified subject matter experts
Step: 2 Unlock
Step: 3 Unlock