

Question: 2. Complete the below table to calculate income statement data in common-size percents. (Round your percentage answers to 2 decimal places.) Selected comparative financial statements
2. Complete the below table to calculate income statement data in common-size percents. (Round your percentage answers to 2 decimal places.)
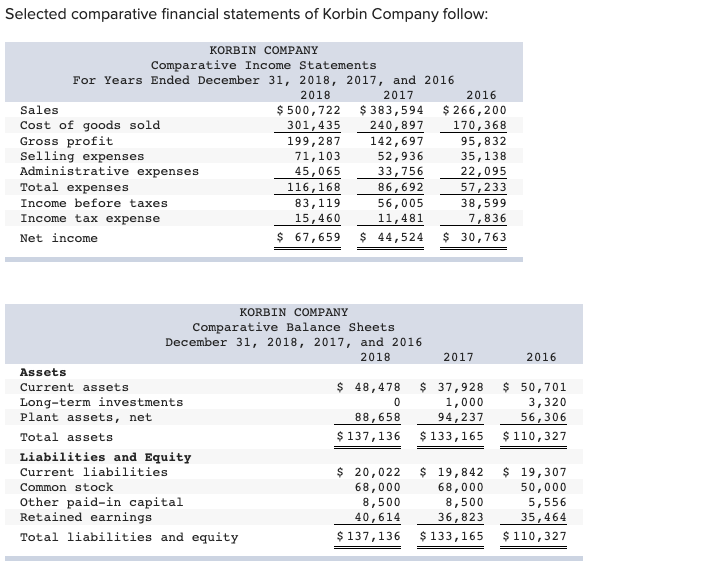
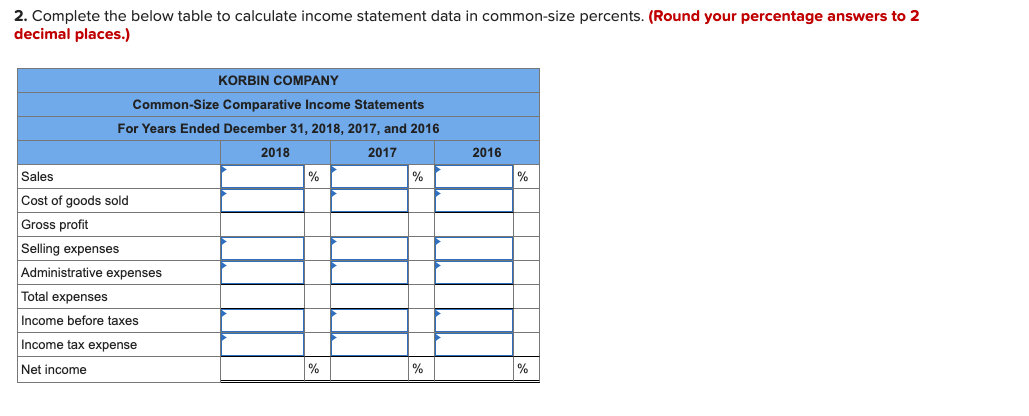
Selected comparative financial statements of Korbin Company follow: KORBIN COMPANY Comparative Income Statements For Years Ended December 31, 2018, 2017, and 2016 2018 2017 2016 $ 383,594 240,897 142,697 $ 266,200 170,368 $ 500,722 Sales Cost of goods sold Gross profit Selling expenses Administrative expenses Total expenses 301,435 95,832 35,138 22,095 199,287 71,103 45,065 52,936 33,756 116,168 86,692 57,233 Income before taxes 83,119 56,005 38,599 7,836 Income tax expense 15,460 11,481 $ 30,763 $ 44,524 $ 67,659 Net income KORBIN COMPANY Comparative Balance Sheets December 31, 2018, 2017, and 2016 2018 2017 2016 Assets $ 48,478 $ 37,928 $ 50,701 Current assets Long-term investments Plant assets, net 1,000 94,237 3,320 56,306 88,658 $ 137,136 $ 133,165 $ 110,327 Total assets Liabilities and Equity Current liabilities $ 20,022 $ 19,842 $ 19,307 Common stock 68,000 8,500 40,614 68,000 8,500 50,000 5,556 35,464 Other paid-in capital Retained earnings 36,823 $ 137,136 $ 110,327 $ 133,165 Total liabilities and equity 2. Complete the below table to calculate income statement data in common-size percents. (Round your percentage answers to 2 decimal places.) KORBIN COMPANY Common-Size Comparative Income Statements For Years Ended December 31, 2018, 2017, and 2016 2018 2017 2016 Sales Cost of goods sold Gross profit Selling expenses Administrative expenses Total expenses Income before taxes Income tax expense Net income
Step by Step Solution
There are 3 Steps involved in it

Get step-by-step solutions from verified subject matter experts